[Integration]{class="badge positive"}
Debugging a Tags implementation debug-tags-implementation
[AEM Sites as a Cloud Service, AEM Sites 6.5]{class="badge informative"}
An introduction to common tools and techniques used to debug a Tags implementation. Learn how to use the browser’s developer console and the Experience Platform Debugger extension to identify and troubleshoot key aspects of a Tags implementation.
Hello, in this video, we are going to take a brief look at some techniques that you can use to debug your launch implementation once it’s been added to your site, and this video is really just intended to be an introduction into some tools and techniques that you can use, and there will be some links at the bottom of this page to additional resources where you can learn a whole lot more. So the first technique I want to show you is just enabling some verbose console messages, and the advantage here is that we can do it in any browser. So I’m using Chrome and I’m just going to pull up my Chrome developer tools, and in the console, we can see that console message, which is coming from our launch property. Now if launch is integrated in the website, you will have this JavaScript object called underscore satellite, and I’m going to run the method set debug to true, and we’ll just go ahead and execute this and nothing gets returned, but now, if I go ahead and refresh the page, we can see an additional log messages in the console, and so right now, the launch implementation is not very complex. I’ve really just got a single rule named launch loaded, but as you add additional extensions and integrations, enabling these debug statements can be very useful, and you also won’t need to add your own debug statements.
Also of note, as you can see from the warnings, using the underscore satellite object should only be done for debugging purposes.
Next, let’s look at some browser extensions. So the first one I’d recommend using and installing is the Adobe Experience Platform Debugger. This is an extension that’s available for both Chrome and Firefox browsers, and the idea behind it is it’s going to analyze the site and inspect it for Experience Cloud implementations. So right now, it’s not connected to any of the pages, but if I go ahead and refresh my current weekend site homepage and then reopen the debugger, you can see now that it is connected to this page, and one thing that’s pretty cool is you can actually lock it to a certain tab that you’re on.
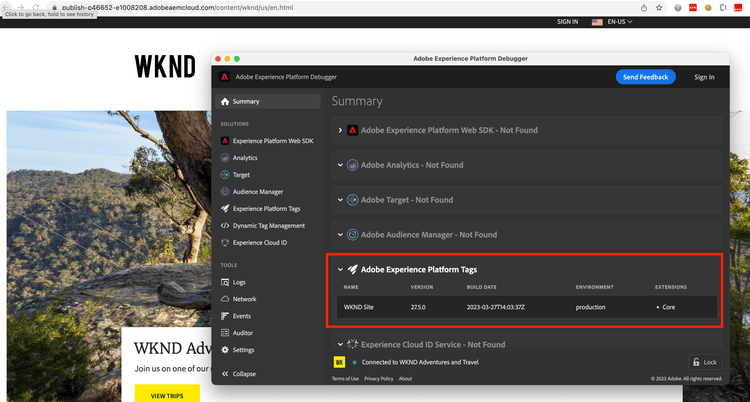
So you’ll also notice that it has inspected the page and it’s recognized that launch has been integrated, and so, if we inspect it further, you can see that it recognizes that we’ve got a single launch property being used. You can see the build date, when it was last built, as well as the environment, and it’ll also tell you any of the extensions you have installed. So right now we just have the core extension. There’s also a number of tools to help you monitor network calls and track events that get fired as part of your implementation. So definitely something worth exploring.
Another extension I want to call out is the Adobe Experience Cloud Debugger. Now this extension is actually older and has some additional features currently not found in the Experience Platform Debugger. It works in a similar fashion, and then after we reload the page, it will inspect it and determine which applications have been implemented. Now, eventually all the functionality will be moved to the Experience Platform Debugger, but wanted to make you aware that there is another extension.
So that concludes this video on introduction to debugging a launch implementation. Below the video, you will find links to additional resources where you can learn a whole lot more. Thanks for watching. -
Client-side debugging via Satellite object
The client-side debugging is helpful to verify Tag property rule loading or order of execution. Whenever a Tag property is added to the website, the _satellite JavaScript object is present in the browser to facilitate the client-side event and data tracking.
To enable the client-side debugging, call the setDebug(true) method on the _satellite object.
-
Open the browser console, and run below command.
code language-javascript _satellite.setDebug(true); -
Reload the AEM site page, and verify console log shows rule fired message like below.

Debugging via Adobe Experience Platform Debugger
Adobe provides Adobe Experience Platform Debugger Chrome extension to debug, understand, and get insight into the integration.
-
Open the Adobe Experience Platform Debugger extension and open the site page on the Publish instance
-
In the Adobe Experience Platform Debugger > Summary > Adobe Experience Platform Tags section, verify your Tag property details such as Name, Version, Build Date, Environment, and Extensions.