Understand the Analytics interface
The Adobe Analytics interface consists of the following key areas, including tabs for managing projects in Analysis Workspace, managing components, tools, and administrator functions.
The following sections describe each area of Analysis Workspace:
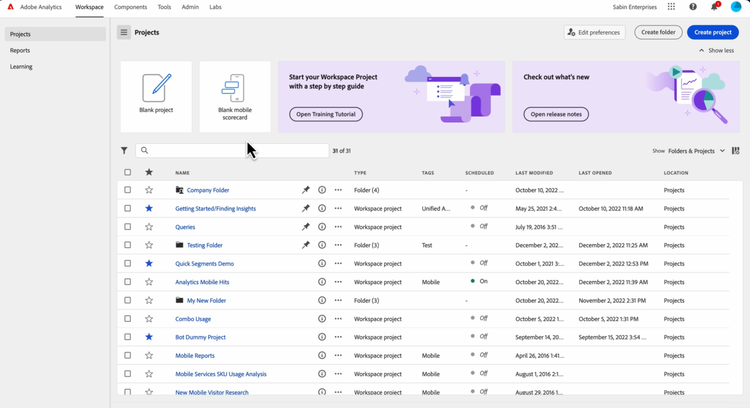
Workspace tab
The Workspace tab shows shows the Projects area by default, which displays the Company folder, any personal folders you created, your projects, and Mobile scorecards.
-
In Adobe Analytics, select the Workspace tab.
For more information about the features and functions available on the Workspace tab, see Adobe Analytics Landing page.
Reports tab
Use the Reports area in the left rail on the Workspace tab. For more information, see Navigate the Reports tab in Adobe Analytics Landing page.
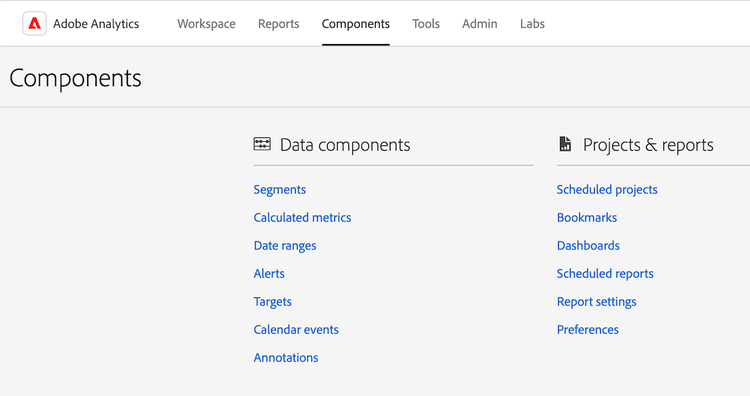
Components tab
The Components tab includes features that help you fine tune and empower your analysis of data.
-
In Adobe Analytics, select the Components tab, then select All components.
-
Select any of the following product features to configure it:
table 0-row-3 1-row-3 2-row-3 3-row-3 4-row-3 5-row-3 6-row-3 7-row-3 8-row-3 9-row-3 10-row-3 11-row-3 12-row-3 layout-auto Product feature Function More information Segments Adobe Analytics lets you build, manage, share, and apply powerful, focused audience segments to your reports using Analytics capabilities, Adobe CX Enterprise, Adobe Target, and other integrated Adobe products. Analytics segmentation Calculated metrics Calculated and Advanced Calculated (or Derived) metrics are custom metrics that you can create from existing metrics. They allow marketers, product managers, and analysts to ask questions of the data without having to change the Analytics implementation. Calculated and Advanced Calculated metrics Date ranges Analysis Workspace includes a list of default date ranges that users can use when building analyses. In addition, you can create custom date ranges and make them available to users in Analysis Workspace. Create custom date ranges Virtual report suites Virtual report suites segment your Adobe Analytics data so you can control access to each segment. Virtual report suites overview Alerts Alerts allow for more granular control over alerts and integrates anomaly detection with the alert system. Alerts overview Annotations Annotations in Workspace enable you to effectively communicate contextual data nuances and insights to your organization. They let you tie calendar events to specific dimensions and metrics. Manage annotations Classification sets Classification sets provide a single interface to manage classifications and rules.
A classification is a way of categorizing Analytics variable data, then displaying the data in different ways when you generate reports. You establish a relationship between a variable value and metadata related to that value. Classifications can be used on most custom dimensions, such as Tracking code, props, and eVars.
Classification sets overview Locations In order to import Adobe Analytics classification data from a cloud destination, you first need to add and configure the location where you want the classification data to be collected. You can create, edit, or delete locations. Locations manager Scheduled projects When managing scheduled projects, you can edit and delete recurring project schedules; search for a schedule in the search bar or by using the filter options in the left rail; and filter by tag, approved schedules, owners and more. Scheduled projects Scheduled reports Admin-level users can see and manage scheduled reports across the organization. Scheduled reports queue Report settings These settings refer to legacy Adobe Analytics products, which excludes Analysis Workspace and its related components. o make adjustments to Analysis Workspace settings, go to Components > Preferences. Preferences Manage settings for Analysis Workspace and its related components for all new projects or panels that you create. Existing projects and panels are not affected. Preferences
Tools tab
-
In Adobe Analytics, select the Tools tab, then select All tools.

-
Select any of the following product features to configure it:
table 0-row-3 1-row-3 2-row-3 3-row-3 4-row-3 5-row-3 6-row-3 7-row-3 layout-auto Product feature Function More information Data Warehouse Data Warehouse refers to the copy of Analytics data for storage and custom reports, which you can run by filtering the data.
The Request Manager lets you view, duplicate, and re-prioritize requests.
Manage Data Warehouse requests Activity Map Activity Map is designed to rank link activity using visual overlays and provide a dashboard of real-time analytics to monitor audience engagement of your web pages. It lets you set up different views to visually identify the acceleration of customer activity, quantify marketing initiatives, and act on audience needs and behaviors. Activity Map overview Recommendations Classic Recommendations is an Adobe Target feature that automatically display products, services, or content that might interest your visitors based on previous user activity, preferences, or other criteria. Recommendations Search & Promote This feature is no longer supported. Mobile Services This feature is no longer supported. Analytics dashboards (mobile app) The Adobe Analytics dashboards app delivers anytime, anywhere insights from Adobe Analytics. Through the app, users can view intuitive Scorecards that you create using the Adobe Analytics desktop UI. The Adobe Analytics dashboards app in the iOS App Store or Google Play store Report Builder Adobe Report Builder is an add-in for Microsoft Excel. It lets you build customized requests from Adobe Analytics data, which you can insert into your Excel worksheets. Requests can dynamically reference cells within your worksheet, and you can update and customize how Report Builder presents the data. What is Report Builder?
Admin tab
The Admin tab includes features and configuration options to administer Adobe Analytics.
-
In Adobe Analytics, select the Admin tab, then select All admin.

-
Select any of the following product features to configure it:
table 0-row-3 1-row-3 2-row-3 3-row-3 4-row-3 5-row-3 6-row-3 7-row-3 8-row-3 9-row-3 10-row-3 11-row-3 12-row-3 13-row-3 14-row-3 15-row-3 16-row-3 17-row-3 18-row-3 19-row-3 20-row-3 21-row-3 22-row-3 23-row-3 24-row-3 25-row-3 26-row-3 layout-auto Product feature Function More information Analytics users & assets While most user and product management functions are now available only in the Adobe Admin Console, the administrative functions of transferring assets from one user to another, as well as setting an expiration date for a user account, are available only from the Adobe Analytics Admin area. Transfer user assets or set account expirations User ID migration The Analytics user ID migration enables administrators to easily migrate user accounts in Analytics User Management to the Adobe Admin Console. Analytics User Migration to the Adobe Admin Console User management home (legacy) User and product management has moved to the Adobe Admin Console. Use the Adobe Admin Console to get started managing user permissions for Adobe Analytics users. Analytics in the Adobe Admin Console Groups (legacy) Group management has moved to the Adobe Admin Console. Use the Adobe Admin Console to get started managing groups for Adobe Analytics. Analytics in the Adobe Admin Console Report suite access The method for granting access to report suite tools has moved to the Adobe Admin Console. Use the Adobe Admin Console to grant report suite access for Adobe Analytics users. Product profile permissions for Report Suite Tools Admin tools home The Analytics admin tools area is the main area for managing your Adobe Analytics instance; this is where most administrative tasks can be done. Admin tools overview Report suites Lets you define the rules that govern how data is processed in a report suite. Report Suite manager Analytics users & assets User and asset management has moved to the Adobe Admin Console. Use the Adobe Admin Console to get started managing user permissions for Adobe Analytics users. Analytics in the Adobe Admin Console Classification importer Use the importer to upload classifications into Adobe Analytics. You can also export the data for updating prior to an import. Classifications importer overview Classification rule builder Rather than maintaining and uploading classifications each time your tracking codes change, you can create automatic, rule-based classifications and apply them across multiple report suites. Classification Rule Builder workflow Data sources Use the data source manager to create, edit, or deactivate data sources. You can also use this interface to track the status of files uploaded to data sources FTP locations. Manage data sources Code manager Code manager lets you download data collection code for web and mobile platforms Code Manager Traffic management The Traffic Management page lets you specify expected traffic volume changes. These settings let Adobe allocate the appropriate resources to ensure that your traffic can be tracked and processed in a timely manner. Traffic management overview Server call usage A server call, also known as a “hit” or an “image request”, is an instance in which data is sent to Adobe servers to process. A Server Call Usage dashboard is available that tracks your server call consumption data and compares it to your contractual limit. You can set up alerts to prevent overages. Server Call Usage overview Logs Log files to help you see when users log in, their usage, access, report suites, and Admin changes. Logs Advertising Analytics Configure Adobe Analytics to show all your Google Ads and Microsoft Advertising paid search data side by side. Configure Advertising Analytics Data feeds Data feeds are a powerful way to get raw data out of Adobe Analytics. This raw data can be used in other platforms outside of Adobe to use at your organization’s discretion. Analytics Data Feed overview Exclude by IP You can exclude data from specific IP addresses, such as internal website activities, site testing and employee usage, from your reports. Excluding data improves report accuracy by excluding IP address data. Additionally, you can remove data from denial of service or other malicious events that can skew report data. You can configure exclusion or by using your firewall. Exclude by IP address Reporting Activity Manager The Reporting Activity Manager lets you see the reporting capacity for each report suite in your organization. It provides detailed visibility into reporting consumption and helps you easily diagnose and fix capacity issues during peak reporting times. Reporting Activity Manager Data Governance Privacy Labeling Labeling report suite data means that you assign identity, sensitivity, and data governance labels to each variable in a given report suite. Privacy labeling Company settings home The Company Settings page lets you configure settings that apply to all report suites managed by your organization. Company settings overview Security manager The Security Manager lets you control access to reporting data. Options include strong passwords, password expiration, IP login restrictions, and email domain restrictions. Security Manager Web services The Web Services APIs provide programmatic access to marketing reports and other Suite services that let you duplicate and augment functionality available through the Analytics interface. Web services Report Builder reports Manage license assigned to Report Builder users. Report Builder reports Single sign-on service Single sign-on in Adobe CX Enterprise is implemented through the Admin Console. Analytics in the Adobe Admin Console Hide report suites Lets you hide report suites in the Adobe Analytics user interface if you no longer want a report suite to be available to you and your users. Hide report suites
Analysis Workspace
Analysis Workspace allows you to quickly build analyses to gather insights and then share those insights with others. Using the drag-and-drop browser interface, you can craft your analysis, add visualizations to bring data to life, curate a dataset, and share and schedule projects with anyone you choose.
The following image and accompanying table explain some of the main areas in Analysis Workspace.
For a more detailed overview of Analysis Workspace, see Analysis Workspace overview.
