Create or edit a data view
Creating a data view involves either creating metrics and dimensions from schema elements or using standard components. Most schema elements can be either a dimension or a metric depending on your business’s requirements. Once you drag a schema element into a data view, options appear on the right where you can adjust how the dimension or metric operates in Customer Journey Analytics.
See

To create or edit a data view:
- Log in to Customer Journey Analytics and select Data views, optionally from Data management, in the top menu.
- To create a data view, select Create new data view. Alternatively, you can select an existing data view from the list of data views to edit it.
Configure configure
To configure a new or existing data view:
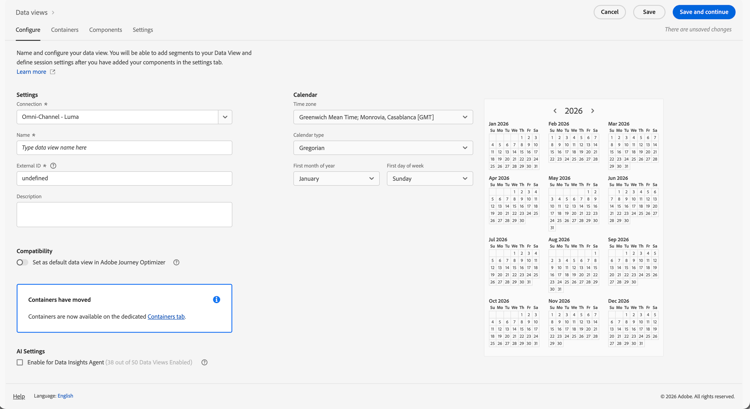
- Select the Configure tab (if not already active).
- Specify Settings, Compatibility, AI Settings, and Calendar details (see below).
- Select Save and continue to continue configuring your new or existing data view. Select Save to save the configuration for your existing data view.
Settings configure-settings
Provides overarching settings for the data view.
unspecified. If you do not specify an external ID, the name will be generated from the Name of the data view, replacing spaces with underscores.Compatibility compatibility
Provides settings that are applicable when using Adobe Journey Optimizer in addition to Customer Journey Analytics.
This section is visible only for administrators who are provisioned with Journey Optimizer.
This configuration option standardizes reporting across Journey Optimizer and Customer Journey Analytics. It also allows you to perform advanced analysis of your Adobe Journey Optimizer data in Customer Journey Analytics (by selecting

To perform this type of analysis, Journey Optimizer needs access to a Customer Journey Analytics data view.
Enable this option to make this the default data view that is used in Journey Optimizer reporting for your sandbox.
This configuration option automatically:
-
Configures all the required Journey Optimizer datasets in the associated connection in Customer Journey Analytics for use with Journey Optimizer.
-
Creates a set of Journey Optimizer metrics and dimension in the data view (including derived fields and calculated metrics). Context labels are automatically set on all of these metrics and dimensions.
-
Automatically enables the Use in CJA option in the connection that is associated with this data view. (To learn more about this option, see Use a Journey Optimizer connection in Customer Journey Analytics.)
If you manually disable this setting after it is enabled, the connection and any associated data views are reset to their default state. This can result in data changes in your reports.
Consider the following when enabling this option:
- You can change the default data view at a later time, but doing so could alter your Journey Optimizer reporting data. If you choose to disable this option after it is enabled, you will be prompted to select a new default data view.
- If you already made manual customizations to the the datasets, dimensions, or metrics in the Customer Journey Analytics data view, your manual customizations remain intact when enabling this configuration option. This option makes additional customizations that further standardize reporting across Journey Optimizer and Customer Journey Analytics. You can also make manual customizations after enabling this option.
- When this option is selected, the connection associated with the data view cannot be deleted.
See Integrate Adobe Journey Optimizer with Adobe Customer Journey Analytics for more information.
AI Settings ai-settings
Select Enable for Data Insights Agent to enable the data view for the Data Insights Agent. The Data Insights Agent is a generative AI conversation agent that helps you quickly analyze your data with text prompts. The agent builds relevant visualizations in Analysis Workspace using components from your data view and using your actual data.
Calendar
Indicates the calendar format that you want the data view to follow. You can have multiple data views based on the same Connection and give them different calendar types or time zones. These data views can allow teams that use different calendar types to accommodate their respective needs with the same underlying data.
Gregorian: Standard calendar format. Quarters are grouped by month.
4-5-4 Retail: A standardized 4-5-4 retail calendar. The first and last months of the quarter contain 4 weeks, while the second month of the quarter consists of 5 weeks.
Custom (4-5-4): Similar to the 4-5-4 calendar except you can choose the first day of the year and which year that the “extra” week occurs.
Custom (4-4-5): The first and second months of each quarter contain 4 weeks, while the last week of each quarter consists of 5 weeks.
Custom (5-4-4): The first month of each quarter consists of 5 weeks, while the second and third month of each quarter consists of 4 weeks.
Extra weeks and leap years
When you select a custom Calendar type (Custom (4‑5‑4), Custom (4‑4‑5), or Custom (5‑4‑4)), leftover days accumulate each year until the days add up to a full extra week (7 days). That extra week is added to the year you select in Year in which the “extra” week occurs.
Leap years are intentionally not shown in the Year in which the “extra” week occurs. However, a leap year can still contain 53 weeks. To force a leap year to contain 53 weeks, select a non‑leap year from Year in which the “extra” week occurs to ensure the cumulative date drift adds up to 7 days for your target leap year. For example: to have 53 weeks in 2024, select 2019. From 2019 to 2024, the total date drift is 7 days (2020 (+2), 2021 (+1), 2022 (+1), 2023 (+1) and 2024 (+2)), which results in a 53rd week in 2024.
The selection for First day of current year affects where the extra week lands. Confirm your configuration using the calendar preview.
Containers
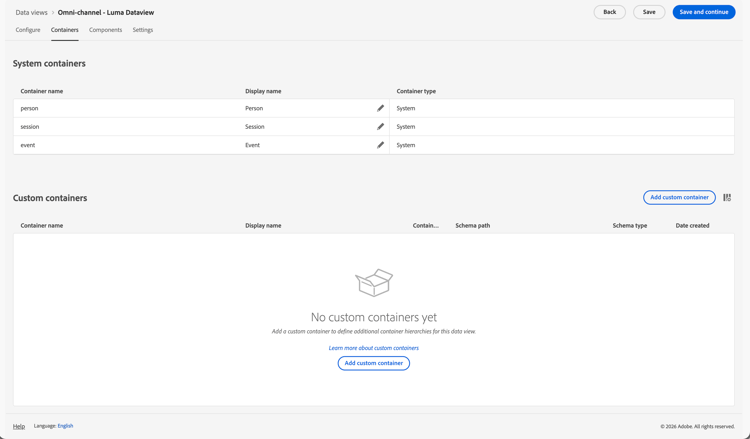
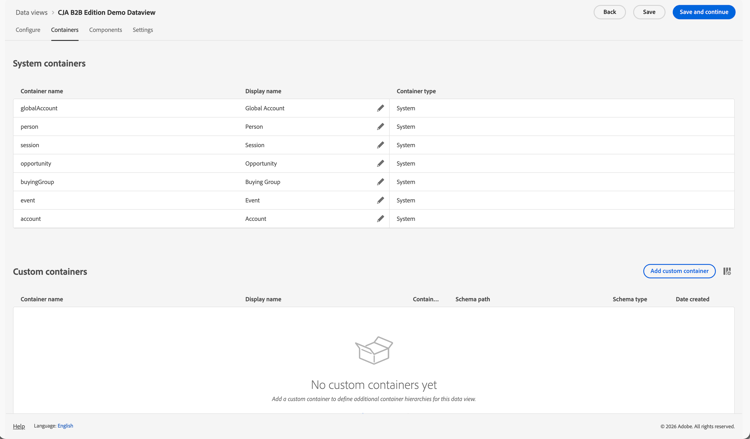
In the Containers tab you can rename system containers and add custom containers.
System containers
Designates the name of containers for the data view. Container names are frequently used in segments.
Global Account
To rename system containers:
- Select

- Define a new name for the container.
- Select Save.
Custom containers
You add custom containers to your data view so you can use these containers for sub-event analysis. Custom containers can be defined from:
- objects or arrays available within the datasets that are part of the connection. For example, productListItems, content_assets, or placeContext.activePOIs.
- derived fields that return an array through the use of the Split function.
- data view components that are configured to return an array using the Substring component settings with the Delimiter option.
To add a custom container:
-
Select Add custom container.
-
In the Add container dialog:
-
Select a container from the Container drop-down menu. For example: productListItems.productCategories. Upon selection, you see updated values for Schema path and Schema type.
-
Enter a Display name for the container. For example:
Product Categories. -
Select Save.
-
To edit a custom container:
-
Select

-
Select
-
In the Edit container dialog:
- Modify Container or Display name or both.
- Select Save.
To delete a custom container:
-
Select
-
Select

note NOTE The custom container is deleted without confirmation.
To change the list of custom containers:
-
Select

-
In Customize table:
- Select the columns to show.
- Select Save.
Components
Next, you can set a data view’s components, which means you can create metrics and dimensions from schema elements. You can also use standard components.
-
Select the Components tab.
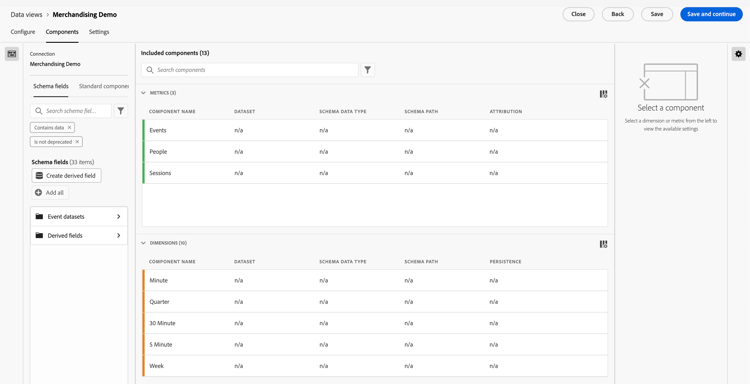
You can see the Connection at the top left, which contains the datasets, and its Schema fields below. All data views include standard components like Events, People, Session metrics, and time dimensions.
- When you define custom containers, metrics are automatically added as

- The system applies the is not deprecated filter by default, so that only non-deprecated Schema fields appear.
- When you define custom containers, metrics are automatically added as
-
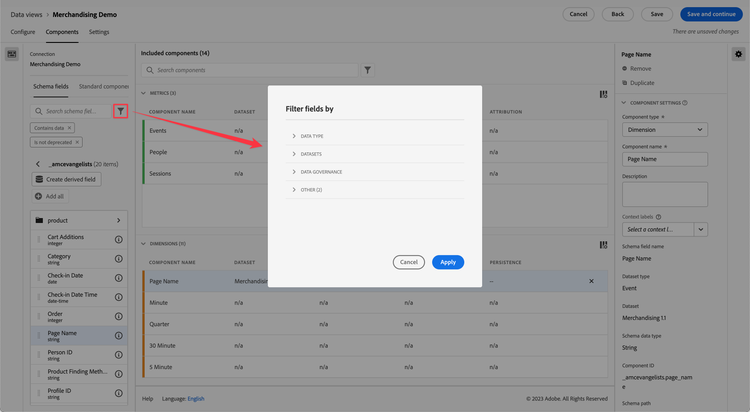
Search for a schema field using


Alternatively, you can create a derived field using
-
When you have found your specific schema field or defined your derived field, drag that field, such as

You can drag the same schema field into the dimensions or metrics sections multiple times and configure the same dimension or metric in different ways. For example, from the pageName field, createProduct PagesandError pagesdimensions using different Component settings on the right.
If you drag a schema field folder from the left rail, the fields in the folder are automatically sorted into the appropriate section. String fields end up in the Dimensions section and numeric schema types end up in the Metrics section. You can also click Add all and all schema fields are added to their respective section. -
Once you select a component, settings appear on the right.
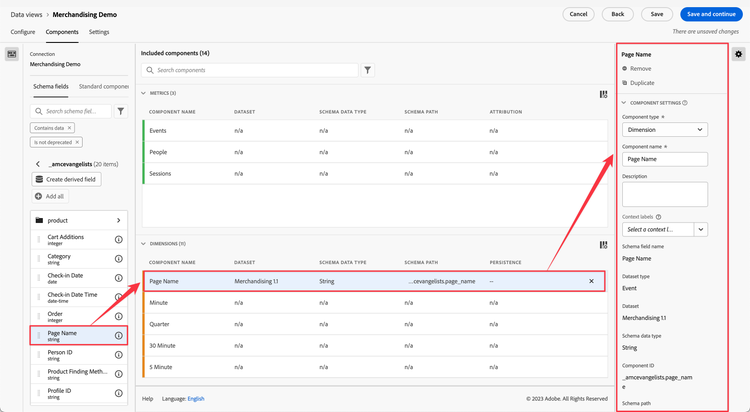
Configure the component using Component settings. Available component settings depend on if the component is a dimension/metric and the schema data type. Settings include:
-
Select Save and continue to continue configuring your new or existing data view. Select Save to save the configuration for your existing data view.
Duplicate metrics or dimensions
Duplicating metrics or dimensions and then modifying specific settings is an efficient way to create multiple metrics or dimensions from a single schema field. Select the Duplicate setting underneath the metric’s or dimension’s name at the top right. Modify the new dimension or metric and save it under a more descriptive name.
Filter schema fields or datasets
You can filter

Included components included-components
The Included components section contains the list of Metrics and Dimensions you configure for the data view.
-
To search for components, use
-
To filter the listed included components, select
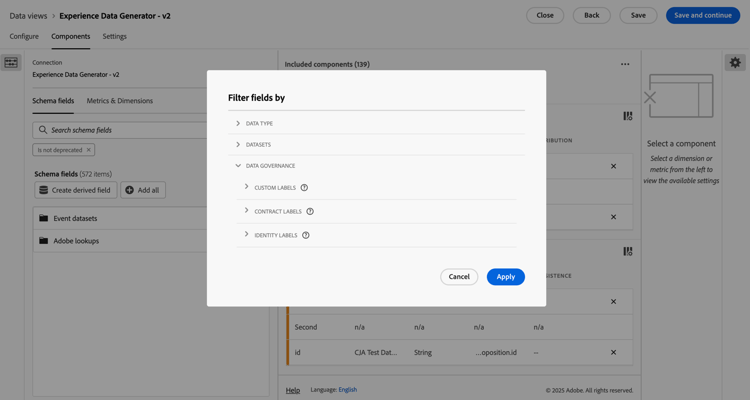
In the Filter field by dialog, you can filter on the following categories:
- Data type - You can select one or more of the following data types: String, Integer, Short, Boolean, Double, Byte, Long, Date, or Date-time.
- Datasets - Select one or more datasets.
- Data governance: Select one or more labels from the Custom labels, Contract labels, Identity labels, Sensitivity labels, Partner ecosystem, or Policies subcategories.
- Other - Select one or more of the options Contains data, Is identity, or Is not deprecated.
Select Apply to apply the filters.
Settings dataview-settings
-
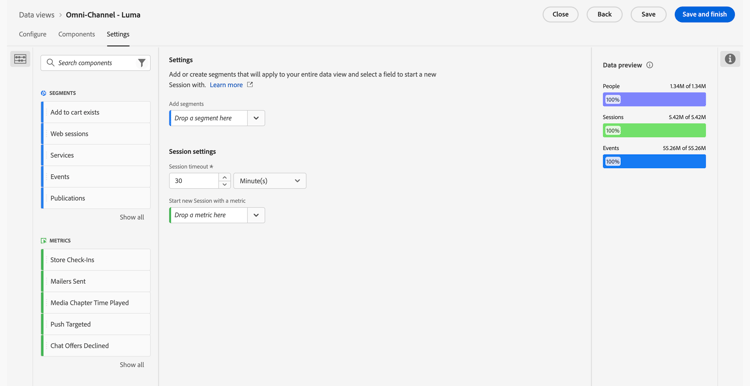
Select the Settings tab.
-
Configure segments to apply to your entire data view. See Settings (segments) below.
-
Configure session timeout and metrics. See Session settings below.
-
Select Save and continue to continue configuring your new or existing data view. Select Save to save the configuration for your existing data view.
Settings (segments) segment-settings
You can add segments that apply to an entire data view. This segment is applied to any report that you run in Workspace. Drag a segment from the components in the left rail to the Add segments field.
Session settings
Determine the time period of inactivity between events before a session expires and a new one is started. A time period is required. You can optionally force a new session to start when an event contains a certain metric. See Session settings for more details.
Data preview
The data preview compares (for the various containers) the data of this data view with data of the connection. The preview percentage is based on the total number in the connection from the last 90 days.
If the preview is not loading, your connection is still backfilling.
Once all desired settings are specified, click Save and finish.