Create a data feed
When creating a data feed, you provide Adobe with:
-
The information about the destination where you want raw data files to be sent
-
The data you want to include in each file
-
The frequency with which data is sent (including the processing delay to capture late-arriving events)
Before you create a data feed, it’s important to have a basic understanding of data feeds and to ensure that you meet all prerequisites. For more information, see Data feeds overview.
Create and configure a data feed create-and-configure-data-feed
title=“”
abstract=“User agent data and device lookup data cannot exist in the same data feed configuration.”
-
Log in to experiencecloud.adobe.com using your Adobe ID credentials.
-
Select Customer Journey Analytics from the app switcher

-
In the top navigation bar, go to Components > Exports.
-
Select the Data feeds tab.
-
Select Create in the upper-right corner of the screen.
Or, if no data feeds have previously been created, select Create data feed within the empty table.
A page displays with the following tabs: Details, Data structure, and Delivery.
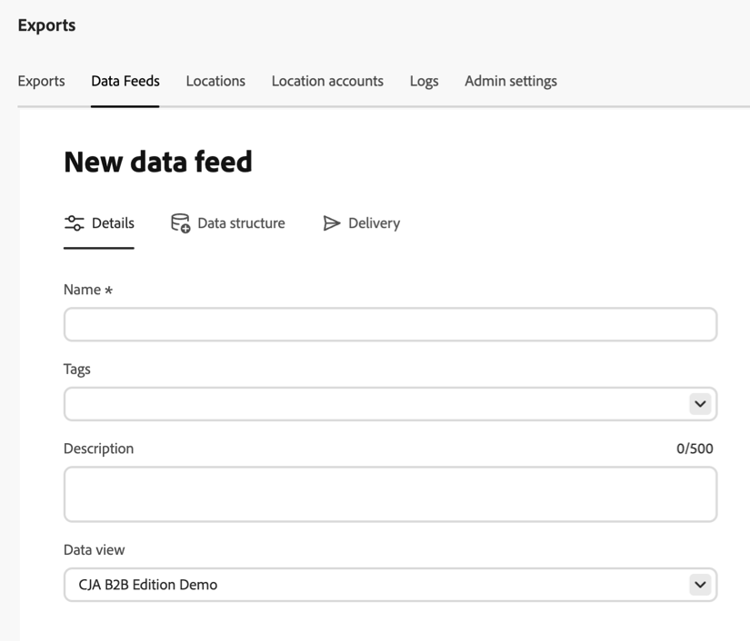
-
On the Details tab, complete the following fields:
table 0-row-2 1-row-2 2-row-2 3-row-2 4-row-2 Field Function Name The name of the data feed. Names must be unique within the selected data view, and can be up to 255 characters in length. Tags Apply any tags to the data feed for easier categorization. Description Specify a description for the data feed (up to 500 characters). The description you add is visible when editing the data feed. Data view Select the data view that contains the data that you want to export.
Consider the following when selecting a data view:
- If multiple data feeds are created for the same data view, each data feed must have different column definitions.
- The list of available columns depends on the login company where the selected data view belongs. If you change the data view, the list of available columns can change.
-
Select Next.
-
On the Data structure tab, make sure the correct data view is selected in the Data view field.
-
In the Segments drop-down menu, search for and select any segments to filter the data included in your feed.
When you apply multiple segments, they are joined together with an AND operator. To join segments with an OR operator, you must first create a new segment in the segment builder, then apply the new segment to the data feed.
Segments you apply here are in addition to any segments that might already be applied in your data view.
-
(Optional) In the left rail, use the search field to locate specific components. Or, select the Sort icon

table 0-row-2 1-row-2 2-row-2 3-row-2 Option Function Recommended Sorts components with those that are recommended at the top of the list. Components that are used most frequently and most recently by you or by others in your organization are shown higher in the list. Alphabetical Sorts components alphabetically. Categorical Sorts components similar to Recommended, except that calculated metrics and standard metrics are grouped separately instead of being mixed together. -
Add components to the data feed configuration. The left rail shows only components that are valid for data feeds.
- Drag-and-drop: Drag components from the left rail to the canvas. Hold Shift, or hold Command (macOS) or Ctrl (Windows) to select and drag multiple components at once.
- Plus button: Select the Plus

- Show all: Select Show all at the bottom of the component list to open a dialog showing all available components. Select the checkbox next to each component you want to add, then select Add selected. When a search term or filter tag is active in the left rail, an Add all button also appears, letting you add all filtered results at once.
When you add a component that belongs to an XDM array field (for example, an Adobe Journey Optimizer proposition field), it appears on the canvas as a collapsible nested group rather than a flat item. The group reflects the underlying data structure and outputs as a nested array in the exported file.
accordion Dimensions that are always included in data feeds The following dimensions are included by default in every data feed and cannot be removed:
table 0-row-4 1-row-4 2-row-4 3-row-4 4-row-4 5-row-4 Dimension name Notes Data feeds Other reporting Timestamp UTC The date and time the event occurred, represented in UTC time zone. Supports sub-second (micro-second) granularity. Required Not available Row ID The unique identifier for each row included in the data feed. Required Not available Session ID The unique identifier for each session included in the data feed. Required Not available Person ID The person identifier for the data view and connection Required Optional standard Account ID [B2B Edition]{class="badge informative" title="Customer Journey Analytics B2B Edition"} Account ID when using the Account container Required Optional standard accordion Dimensions that cannot be included in data feeds Customer Journey Analytics standard dimensions cannot be included in data feeds. The following table lists these dimensions:
table 0-row-3 1-row-3 2-row-3 3-row-3 4-row-3 5-row-3 6-row-3 7-row-3 8-row-3 9-row-3 10-row-3 11-row-3 12-row-3 13-row-3 14-row-3 15-row-3 16-row-3 17-row-3 18-row-3 Dimension name Notes Data feeds 5 Minute Five-minute intervals when events occurred (rounded down) Not available 15 Minute Fifteen-minute intervals when events occurred (rounded down) Not available 30 Minute Thirty-minute intervals when events occurred (rounded down) Not available Day Day an event occurred Not available Day of Week Day of the week an event occurred Not available Day of Month Day of the month an event occurred Not available Hour Hour an event occurred (rounded down) Not available Hour of Day Hour of the day an event occurred (rounded down) Not available Minute Minute an event occurred (rounded down) Not available Minute of Hour Minute of the hour an event occurred (rounded down) Not available Month Month an event occurred Not available Month of Year Month of the year an event occurred Not available Quarter Quarter an event occurred Not available Quarter of Year Quarter of the year an event occurred Not available Second Second an event occurred (rounded down) Not available Week Week an event occurred Not available Week of Year Week of the year an event occurred Not available Year Year an event occurred Not available accordion Metrics that cannot be included in data feeds The following Customer Journey Analytics standard metrics cannot be included in data feeds:
table 0-row-3 1-row-3 2-row-3 3-row-3 4-row-3 5-row-3 6-row-3 7-row-3 8-row-3 9-row-3 10-row-3 11-row-3 Metric name Notes Data feeds Adobe Visitors Profile Not available Adobe Opportunities Union Not available Adobe Opportunities Profile Not available Adobe Accounts Union Not available Adobe Accounts Profile Not available Adobe Buying Groups Union Not available Adobe Buying Groups Profile Not available Adobe Global Accounts Union Not available Adobe Global Accounts Profile Not available Adobe Persons Union Not available Adobe Persons Profile Not available accordion Dimensions that cannot be used together in data feeds note important IMPORTANT Certain dimensions cannot be used together in Experience Platform datasets, and therefore cannot be included in the same data feed. If you choose to include either the User Agent or Mobile ID dimensions in your data feed, the dimensions listed below cannot be added to the data feed. If you use the Web SDK, this restriction is enforced in datastreams before data arrives in an Experience Platform dataset. For more information, see Configure device lookup in Create and configure datastreams in the Data Collection guide. The following dimensions cannot be used together with the User Agent or Mobile ID dimensions:
- Browser Type
- Browser
- Mobile Manufacturer
- Mobile Device Type
- Mobile Audio Support
- Mobile DRM
- Mobile Java VM
- Mobile Information Services
- Mobile Image Support
- Mobile Color Depth
- Mobile Net Protocols
- Mobile Device Number
- Mobile Max Email Length
- Mobile Mail Decoration
- Mobile Push To Talk
- Mobile Screen Width
- Mobile Max Browser URL Length
- Mobile Operating System (deprecated)
- Mobile Screen Height
- Mobile Video Support
- Mobile Cookie Support
- Mobile Max Bookmark Length
- Mobile Screen Size
- Mobile Device Name
- Operating System Types
- Operating Systems
accordion Metrics that must be substituted in data feeds The following Customer Journey Analytics metrics must be substituted:
table 0-row-3 1-row-3 2-row-3 3-row-3 4-row-3 5-row-3 6-row-3 7-row-3 8-row-3 9-row-3 10-row-3 11-row-3 Metric name Notes Data feeds Accounts [B2B Edition]{class="badge informative" title="Customer Journey Analytics B2B Edition"} Based on Account ID specified in the connection Not available. Use count distinct of Account ID. Buying Group [B2B Edition]{class="badge informative" title="Customer Journey Analytics B2B Edition"} Buying groups based on Buying Group ID in the connection Not available. Use count distinct of Buying Group ID. Events Number of rows from all event datasets in a connection Not available. Use count distinct of Row ID. Global Accounts [B2B Edition]{class="badge informative" title="Customer Journey Analytics B2B Edition"} Based on Global Accounts ID in the connection Not available. Use count distinct of Global Accounts ID. Opportunities [B2B Edition]{class="badge informative" title="Customer Journey Analytics B2B Edition"} Opportunities based on Opportunity ID in the connection Not available. Use count distinct of Opportunity ID. People Based on Person ID specified in a connection Not available. Use count distinct of Person ID. Conversations Number of conversations Not available. Use count distinct of Conversation ID. Session Ends Number of events that were the last event of a session Not available Session Starts Number of events that were the first event of a session Not available Sessions Based on the data view’s session settings Not available. Use count distinct of Session ID. Time Spent (seconds) Sums the time between two different dimension values Not available accordion Optional standard components table 0-row-4 1-row-4 2-row-4 3-row-4 4-row-4 5-row-4 6-row-4 7-row-4 8-row-4 9-row-4 10-row-4 11-row-4 12-row-4 13-row-4 14-row-4 15-row-4 16-row-4 17-row-4 18-row-4 19-row-4 20-row-4 21-row-4 22-row-4 Component name Type Notes Data feeds AM/PM Time-parting dimension AM or PM Not available Batch ID Dimension Identifier for an Experience Platform batch Available Dataset ID Dimension Identifier for an Experience Platform dataset Available Day of Month Time-parting dimension 1–31 Not available Day of Week Time-parting dimension Monday through Sunday Not available Day of Year Time-parting dimension 1–366 Not available Event Depth Dimension Sequential numerical value (1, 2, 3, etc.) assigned to each event interaction within a session
Resets at the start of each new session
Available Hour of Day Time-parting dimension 0–23 Not available Month of Year Time-parting dimension January–December Not available First-time Sessions Metric A person’s first defined session within the reporting window Not available Return Sessions Metric Sessions that were not a person’s first-time session Not available Person ID namespace Dimension Type of ID the Person ID consists of (for example, email or cookie ID) Available Global Account ID [B2B Edition]{class="badge informative" title="Customer Journey Analytics B2B Edition"} Dimension Global Account ID when using the Global Account container Available Opportunity ID [B2B Edition]{class="badge informative" title="Customer Journey Analytics B2B Edition"} Dimension Opportunity ID when using the Opportunity container Available Buying Group ID [B2B Edition]{class="badge informative" title="Customer Journey Analytics B2B Edition"} Dimension Buying Group ID when using the Buying Group container Available Quarter of Year Time-parting dimension Q1, Q2, Q3, Q4 Not available Repeat Session Metric Sessions that were not a person’s first-ever session Not available Session Type Dimension Two values: First-Time or Returning Not available Time Spent per Event Dimension Buckets the Time Spent metric into event buckets Not available Time Spent per Session Dimension Buckets the Time Spent metric into session buckets Not available Time Spent per Person Dimension Buckets the Time Spent metric into person buckets Not available Weekend/Weekday Time-parting dimension Weekend or Weekday Not available -
(Optional) Reorder components on the canvas by dragging them. The order you define is preserved as the column order in the exported data feed file.
-
(Optional) Change the component ID that is displayed in the data feed output.
-
Hover over a component on the canvas, then select the information icon.
-
In the Component ID field, specify a new component ID.
-
-
(Optional) Use the Feed summary and Schema preview panels on the right side of the page to review your data structure before proceeding:
- The Feed summary shows a live count of the total components, columns, dimensions, and metrics that you added.
- The Schema preview shows a JSON representation of the data feed schema that updates as you add or reorder components.
- The Example rows button opens a dialog that shows example output rows so you can verify that the structure looks correct. This dialog shows example data only and does not reflect your actual data.
-
On the Delivery tab, in the Schedule section, choose the type of feed you want to create (live or backfill), then specify the reporting window, frequency, and other configuration options:
table 0-row-2 1-row-2 2-row-2 3-row-2 4-row-2 5-row-2 6-row-2 7-row-2 8-row-2 Field Function Feed type Select the type of feed you want to create:
- Live feed: Exports current and future data.
- Backfill feed: Exports historical data.
Start date The date when the data feed begins. For live feeds, this must be today or a future date. For backfill feeds, this must be a past date within the data view’s data retention window. The start date is based on the data view’s time zone. Expiration date
Available only for live feedsThe date when the data feed expires and no longer runs. The date is based on the data view’s time zone. End date
Available only for backfill feedsThe date when the data feed ends. The end date cannot be in the future. The date is based on the data view’s time zone. Frequency Select how often the data feed should be sent. Events with timestamps that fall within the frequency window are included in the data feed delivery. The Lookback date range and Processing delay fields can also affect which events are included in the data for the delivery frequency that you choose.
For live feeds, select to include either one hour’s worth of data or one day’s worth of data. For backfill feeds, this field is locked to Daily, meaning that data is grouped into daily chunks.
-
Daily: Feeds contain a full day’s worth of data, from midnight to midnight in the data view’s time zone.
This option is required for backfill feeds and is optional for live feeds.
-
Hourly: Feeds contain a single hour’s worth of data.
This option is available for live feeds only.
Lookback date range Controls how far back Customer Journey Analytics looks when processing the data feed delivery. The default is 30 days.
The frequency window (hour or day) determines which events are included in the data feed, while the lookback date range provides the needed historical context to classify those events correctly.
Segment qualification, dimension persistence, session calculation, and derived field transformations can all affect the events that are included.
Before configuring this option, see the details and examples described in the section below, Understand the lookback date range.
Processing delay Choose the amount of time to wait before processing a data feed file. The default is 2 hours. Any late-arriving events that come in during the processing delay are included in the data feed.
Processing delays are useful for various reasons, such as to give mobile implementations an opportunity for offline devices to come online and send data, or to accommodate your organization’s server-side processes in managing previously processed files.
Sessions must start after the processing delay cutoff in order to be included; sessions that start before the cutoff and end within the processing delay are not included.
Customer Journey Analytics dynamically determines the optimal delay based on how long late-arriving events typically take for your feed, but you can manually set it to delay for 2, 3, 4, or 8 hours.
Compression format Select the compression format for the Parquet output files delivered to your cloud destination. Choose from the following formats:
- Snappy: Fast compression and decompression with moderate file sizes. Widely supported by modern data platforms such as BigQuery, Snowflake, and Apache Spark.
- GZip: Broadly compatible, including with tools that do not natively support Snappy. Recommended if your downstream pipeline requires a widely recognized compression standard.
- Z Standard (Zstd): High compression efficiency with fast decompression. Suitable if minimizing file size is a priority and your tools support Zstd.
-
On the Delivery tab, in the Destination section, configure the destination where you want the data to be sent.
note NOTE Consider the following when configuring a report destination: -
Any cloud accounts that you previously configured are available to use for data feeds. You can configure cloud accounts from the Locations manager, in Components > Exports > Location accounts.
-
Cloud accounts are associated with your Customer Journey Analytics user account. Other users cannot use or view cloud accounts that you configure unless you make them available to all users in your organization.
-
You can edit any locations that you create from the Locations manager in Components > Exports > Locations.
Complete the following fields:
table 0-row-2 1-row-2 2-row-2 3-row-2 4-row-2 5-row-2 Field Function View destinations for all users If you are a system administrator, you can enable this option to view destinations created by all users in your organization. When this option is disabled, only destinations you created are displayed. Account Do either of the following:
-
Use an existing account: Select the drop-down menu next to the Account field. Or, begin typing the account name, then select it from the drop-down menu.
Accounts are available to you only if you configured them or if they are shared with an organization you are a part of.
-
Create a new account: Select Add account within the Account drop-down menu. For information about how to configure the account, see Configure cloud export accounts.
Location Do either of the following:
- Use an existing location: Select the drop-down menu next to the Location field. Or, begin typing the location name, then select it from the drop-down menu.
- Create a new location: Select Add location within the Location drop-down menu. For information about how to configure the location, see Configure cloud export locations.
Notify by email when complete Specify one or more email addresses where a notification should be delivered after the data feed is successfully sent or fails to send. Multiple email addresses must be separated with a comma. Enable manifest Choose whether to include a manifest file with each data feed delivery. The manifest file contains information for each file included in the data feed. -
-
Select Save.
Understand the lookback date range data-feed-lookback-date-range
The lookback date range controls how far back Customer Journey Analytics looks when processing each data feed delivery.
Events must still have timestamps that fall within the frequency window (hour or day) to be included in the delivery, but the data that falls within the lookback date range provides the needed historical context to classify those events correctly.
When configuring this option, consider the following important concepts:
- A longer lookback date range typically results in more accurate data; a shorter range results in better delivery performance.
- The lookback date range, together with the frequency window, function similarly to the Analysis Workspace reporting date range. However, there are key differences. These differences can result in data discrepancies between Workspace reports and data feed deliveries.
Segment qualification, session calculation, dimension persistence, and derived field transformations are each considered when processing data within the lookback date range:
Segment qualification
When a segment is applied to your data feed definition, data within the lookback date range determines which events, sessions or people qualify for the segment. The segment’s container setting determines the scope. (Possible containers are: Person, Session, or Event. B2B includes the following additional containers: Global account, Account, Opportunity, Buying group.)
Example:
Suppose you want to create a data feed to understand the behavior of users who are part of a specific marketing campaign, Campaign B.
To accomplish this, you apply a segment to the data feed called Users in Campaign B, indicating that only those events tied to users in this segment should be included in the data feed.
In this case, users are included in the data feed only if they meet both of the following conditions:
-
The user had an event with a timestamp that is within the data feed frequency window (the given hour or day of the data feed).
-
The user qualified for the Campaign B segment sometime within the lookback date range.
For a qualifying event that occurred 9 days ago, this means the user would be included in the data feed if the lookback date range were set to 30 days, but the user would not be included in the data feed if the lookback date range were set to 7 days.
Session calculation
Session boundaries are calculated using data within the lookback date range.
Dimension persistence
When you set persistence on an individual dimension, you also set an expiration to determine how long the dimension item persists beyond the event it is set on.
The lookback date range affects dimension persistence when the expiration is set to either of the following options in the data view:
-
Person Reporting Window: The lookback date range becomes the new reporting window for each dimension in the data feed definition that uses Person Reporting Window as its expiration.
-
Custom Time: If the custom time that is selected extends beyond the lookback date range, the custom time is ignored, and the lookback date range is used for dimension expiration for each dimension in the data feed definition that uses Custom Time as its expiration. Values that occurred before the lookback date range are not considered.
For more information about setting persistence on dimensions within the data view, see Persistence component settings.
To get the most accurate data, consider setting the lookback date range to a value equal to or greater than the persistence set on dimensions in your data. However, keep in mind that a shorter lookback date range results in better performance for data feed deliveries.
Example:
Suppose that in your data feed you want to know which marketing campaign users originally saw before coming to your site.
To accomplish this, you set persistence on the Campaigns dimension with Original as the allocation model.
In this case, the original campaign is shown in the data feed output only if users meet both of the following conditions:
-
The user had an event with a timestamp that is within the data feed frequency window (the given hour or day of the data feed).
-
The user qualified for the original campaign sometime within the lookback date range.
If the user qualified for the original campaign 9 days ago, the original campaign is included in the data feed if the lookback date range is set to 30 days, but the original campaign is not included in the data feed if the lookback date range is set to 7 days.
Derived field transformations
Any derived field functions that reference containers use the lookback date range in data feed exports. What date capabilities exist in derived fields?