このページ:では、Adobe Journey Optimizerのすぐに使用できるレポート機能を使用して、カスタムチャネルのライフサイクルを管理し、配信パフォーマンスを監視する方法について説明します。これには、配信成功、エラー、リンククリックなどの指標が含まれます。
カスタムチャネルを作成してアクティブ化すると、そのライフサイクルを管理し、Journey Optimizer インターフェイスを通じて配信パフォーマンスを監視できます。
キャンペーンとジャーニーのレポートの活用 reporting
Journey Optimizerは、カスタムチャネル用のすぐに使用できるレポートを提供します。
カスタムチャネルキャンペーンレポートについて詳しくは、この節を参照してください。
ライブ (24時間)およびグローバル (CJA) レポートの両方で、カスタムチャネルに対して次の指標を使用できます。
ライブレポート および グローバルレポート の詳細をご覧ください。 レポート機能について詳しくは、このドキュメント を参照してください。
配信パフォーマンスの監視 monitoring
Journey Optimizerには、キャンペーンとジャーニーレポートに加えて、専用のカスタムチャネル監視ダッシュボードが用意されています。 管理 > チャネル > チャネルビルダー > カスタムチャネル監視からアクセスできます。
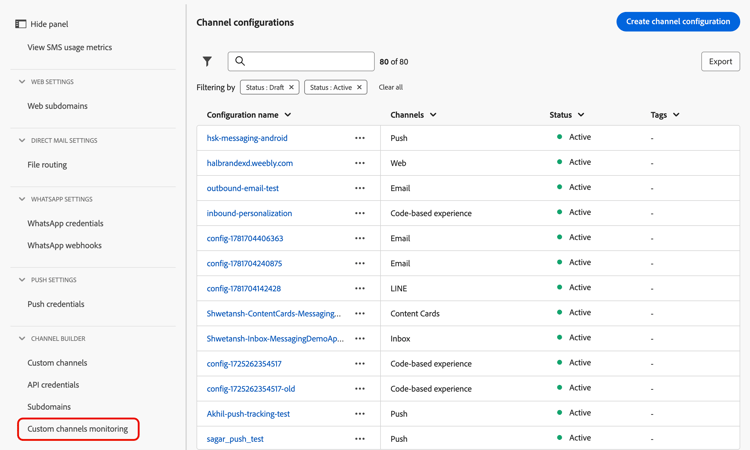
このダッシュボードでは、カスタムチャネルメッセージを配信する際に、Journey Optimizerが外部エンドポイントに対して行うAPI呼び出しの信頼性とパフォーマンスを監視できます。 統合の問題、待ち時間、スロットリングの制限をすばやく特定するために使用します。
カスタムチャネル監視 ダッシュボードは、Journey Optimizerの他の常時レポートと同様に機能します。 時間範囲を選択し、チャネルまたはエンドポイントでフィルタリングし、ドリルダウンして、各カスタムチャネルに依存するキャンペーンとジャーニーを確認できます。 詳細情報
カスタムチャネル指標 monitoring-kpis
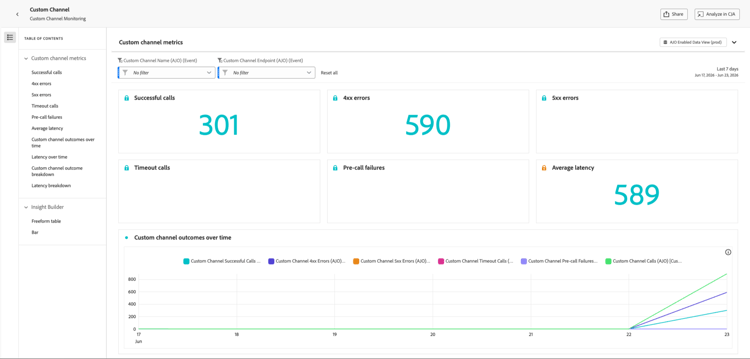
「カスタムチャネル指標」セクションでは、カスタムチャネル呼び出しの運用上の健全性と信頼性の統合ビューを提供します。
-
成功した呼び出し:エラーなしで有効な応答を返した HTTP 呼び出しの合計数。
-
4xx/5xxエラー:クライアントサイド(4xx)またはサーバーサイド(5xx)のエラーにより失敗した呼び出しの数。設定の問題またはエンドポイントのエラーがハイライト表示されます。
-
タイムアウト呼び出し: 最大応答時間を超えたので失敗した呼び出しの数。 これは、外部エンドポイントの待ち時間やパフォーマンスの問題を明らかにするのに役立ちます。
-
事前呼び出しエラー:外部エンドポイントへの HTTP 呼び出しが行われる前に失敗したカスタムチャネル送信の数。 これらのエラーは、外部システムではなく、Journey Optimizer独自のインフラストラクチャ層で発生します。 3つのカテゴリがあります。
table 0-row-2 1-row-2 2-row-2 3-row-2 カテゴリ 説明 認証エラー ( AUTH_*)Journey Optimizerは、エンドポイントの呼び出しに必要なOAuth トークンまたは資格情報を取得または更新できませんでした。 チャネル設定にリンクされているAPI資格情報が有効で、有効期限が切れていないことを確認します。 リクエスト生成エラー ( REQUEST_GENERATION_ERROR)Journey Optimizerは、有効なHTTP リクエストを作成できませんでした。例えば、URL テンプレートを解決できなかったか、必須のパーソナライゼーションフィールドが見つからなかったなどです。 HTTP解析エラー ( HTTP_PARSE_ERROR)Journey Optimizerはエンドポイントから応答を受け取りましたが、それを使用可能な構造に解析できませんでした。 note tip TIP 事前呼び出しエラーは、外部エンドポイントの問題ではなく、Journey Optimizer側またはチャネル設定の問題を示します。 API資格情報と必須ペイロードフィールドを確認して、トラブルシューティングを開始します。 -
平均待ち時間:成功した呼び出し、エラー、タイムアウトを含む、すべての HTTP 呼び出しの平均エンドツーエンド応答時間(ミリ秒単位)。
カスタムチャネルの長期的な成果 outcomes-overtime
カスタムチャネルの経時的な結果 グラフは、選択した期間におけるHTTP呼び出しKPIの傾向を示しています。 時系列の精度は、選択した時間範囲によって異なります。
- 7日間のレポートの場合、各データポイントは1日のKPIを示します。
- 1日間の時間範囲の場合、グラフには1時間あたりのKPIが表示されます。
- 1時間の時間範囲の場合、グラフには1分あたりのKPIが表示されます。
待ち時間の推移 latency-overtime
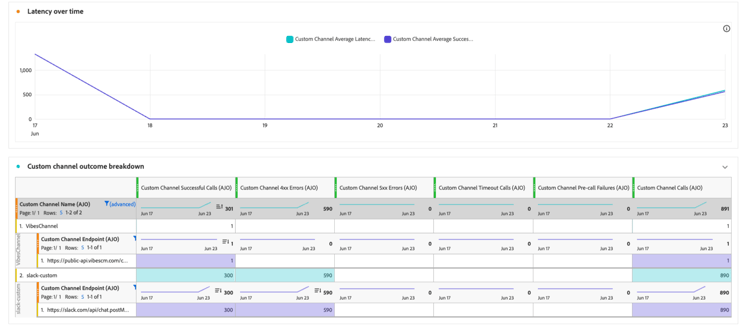
待ち時間の推移グラフには、選択した期間の待ち時間指標のトレンドが視覚化されます。 この時系列ビューを使用すると、パフォーマンスパターンを追跡し、ピーク時の待ち時間を特定して、最適化やシステム変更による影響を時間の経過と共に監視できます。
カスタムチャネル結果の内訳 outcome-breakdown
カスタムチャネル成果分類 テーブルは、HTTP呼び出し指標の階層的な内訳を提供します。上位レベルのエンドポイントごとの全体的な指標から、そのエンドポイントを使用するカスタムチャネルごとの指標、下位レベルでそれらを使用するキャンペーンやジャーニーに至るまで、HTTP呼び出し指標の階層的な内訳を示します。
待ち時間分類 latency-breakdown
レイテンシの内訳 テーブルには、カスタムチャネル間のレイテンシ指標の詳細な内訳が表示されます。 このビューにより、パフォーマンスの問題が発生している特定のエンドポイントやチャネルを特定し、遅延のボトルネックを効果的に特定して対処できます。
Insight Builder insight-builder
Insight Builderを使用して、カスタムチャネル指標に基づくカスタムビジュアライゼーションとダッシュボードを作成します。 このツールを利用することで、複数のKPIを組み合わせて、フィルターを適用し、モニタリングとレポートのニーズに合わせてカスタマイズされたビューを作成できます。 詳細情報
トラブルシューティング troubleshooting
カスタムチャネルで問題が発生した場合は、一般的な現象、考えられる原因、推奨される解決策を次の表に示します。
{{profile.person.name.firstName | default("Valued Customer")}}。This section contains structured knowledge intended to support interpretation, retrieval, and question answering related to this topic.
For complete understanding, this information should be combined with the documentation on this page. Neither source is intended to stand alone; the page describes the feature, while this section provides additional context that helps disambiguate terminology, intent, applicability, and constraints.
- TL;DR: This page explains how to monitor custom channel delivery performance in Journey Optimizer using out-of-the-box campaign and journey reports and the dedicated custom channel monitoring dashboard, and how to troubleshoot common delivery issues.
Intents:
- Monitor custom channel delivery performance through out-of-the-box campaign and journey reports
- Access and use the custom channel monitoring dashboard
- Interpret custom channel metrics such as successful calls, errors, timeouts, and pre-call failures
- Analyze outcomes and latency over time and break them down by endpoint, channel, campaign, and journey
- Troubleshoot common custom channel delivery symptoms and apply recommended resolutions
Glossary:
- Custom channels monitoring dashboard: A dedicated dashboard accessed from Administration > Channels > Channel Builder > Custom channels monitoring that monitors the reliability and performance of the API calls Journey Optimizer makes to external endpoints (product-specific)
- Pre-call failures: Custom channel sends that failed before the HTTP call was ever made to the external endpoint; these occur in Journey Optimizer’s own infrastructure layer and fall into three categories: authentication failures (
AUTH_*), request generation errors (REQUEST_GENERATION_ERROR), and HTTP parse errors (HTTP_PARSE_ERROR) (product-specific) - Timeout calls: Number of calls that failed because they exceeded the maximum response time (product-specific)
- Insight Builder: A tool used to create custom visualizations and dashboards based on custom channel metrics (product-specific)
- Successful deliveries: Messages for which the endpoint returned an HTTP 2xx response (product-specific)
Guardrails:
- Clicks metric tracking requires a subdomain delegated for custom channels.
- Pre-call failures indicate a problem on the Journey Optimizer side or in the channel configuration, rather than an issue with your external endpoint; start troubleshooting by reviewing API credentials and required payload fields.
- Average latency is the average end-to-end response time in milliseconds for all HTTP calls, including successful calls, errors, and timeouts.
- Report granularity depends on the selected time range: a 7-day report shows KPIs per day, a 1-day range shows KPIs per hour, and a 1-hour range shows KPIs per minute.
- HTTP 401/403 errors indicate an authentication failure; update the credentials in Administration > Channels > API credentials.
- HTTP 429 errors indicate the external endpoint is throttling requests; review your endpoint’s rate limits and reduce the throttling setting in the Channel Builder policy configuration.
Terminology:
- Canonical name: Custom channels monitoring dashboard — Acronym: n/a — variants: custom channel monitoring dashboard
- Report metric “Attempted deliveries”: total number of messages sent to the external endpoint
- Do not confuse: “Successful deliveries” (report metric: messages for which the endpoint returned an HTTP 2xx response) ≠ “Successful calls” (monitoring metric: total HTTP calls that returned a valid response without error)
- Do not confuse: “4xx/5xx errors” (failed calls due to client-side or server-side errors) ≠ “Timeout calls” (calls that exceeded the maximum response time) ≠ “Pre-call failures” (sends that failed before the HTTP call was made)
FAQ:
- Q: Where can I monitor custom channel performance? — Through out-of-the-box campaign and journey reports and the dedicated custom channel monitoring dashboard, accessed from Administration > Channels > Channel Builder > Custom channels monitoring.
- Q: What does the Clicks metric require? — The Clicks metric counts link clicks tracked in the payload and requires a subdomain delegated for custom channels.
- Q: What are pre-call failures? — Custom channel sends that failed before the HTTP call was ever made to the external endpoint; they occur in Journey Optimizer’s own infrastructure layer and include authentication failures, request generation errors, and HTTP parse errors.
- Q: My calls return HTTP 429 errors. What should I do? — The external endpoint is throttling requests from Journey Optimizer; review your endpoint’s rate limits and reduce the throttling setting in the Channel Builder policy configuration.
- Q: How does the report time granularity change with the time range? — A 7-day report shows one data point per day, a 1-day range shows KPIs per hour, and a 1-hour range shows KPIs per minute.
- Q: How do I troubleshoot unresolved personalization tokens? — Verify the XDM attribute path is correct and add a default value fallback, for example
{{profile.person.name.firstName | default("Valued Customer")}}.