在此页面上:了解如何通过Adobe Journey Optimizer的开箱即用报告(包括成功投放、错误和链接点击等量度)管理自定义渠道的生命周期并监控投放性能。
创建并激活自定义渠道后,您可以管理其生命周期,并通过Journey Optimizer界面监控投放性能。
利用营销活动和历程报告 reporting
Journey Optimizer为自定义渠道提供现成的报告。
自定义渠道营销活动报告在此部分中有详细说明。
以下量度可用于实时(24h)和全局(CJA)报表中的自定义渠道。
了解有关实时报告和全局报告的更多信息。 有关报告功能的详细信息,请参阅本文档。
监控投放效果 monitoring
除了营销活动和历程报告外,Journey Optimizer还提供专用的自定义渠道监视仪表板。 从管理 > 渠道 > 渠道生成器 > 自定义渠道监控访问它。
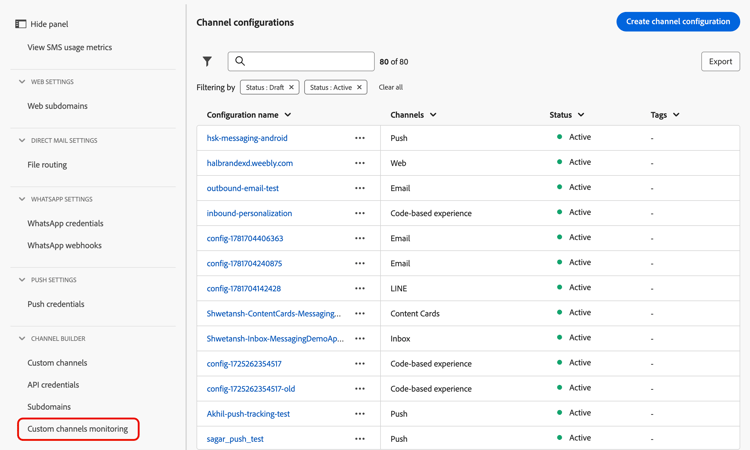
此仪表板允许您监视在传递自定义渠道消息时Journey Optimizer对外部端点进行的API调用的可靠性和性能。 使用它可以快速发现集成问题、延迟和限制因素。
自定义渠道监控仪表板的功能与Journey Optimizer中的其他所有时间报告类似。 您可以选择时间范围、按渠道或端点筛选,并深入查看依赖每个自定义渠道的营销活动和历程。 了解详情
自定义渠道量度 monitoring-kpis
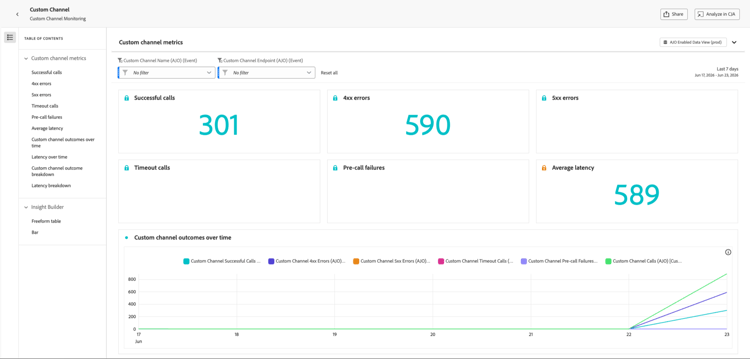
自定义渠道量度部分提供了自定义渠道调用的运行状况和可靠性的综合视图。
-
成功的调用:返回有效响应且无错误的HTTP调用总数。
-
4xx/5xx错误:由于客户端(4xx)或服务器端(5xx)错误,突出显示配置问题或终结点故障而失败的调用数。
-
超时调用:因超过最大响应时间而失败的调用数。 这有助于显示外部端点的滞后或性能问题。
-
预调用失败:在对外部端点进行HTTP调用之前失败的自定义渠道发送次数。 这些故障发生在Journey Optimizer自己的基础结构层,而不是外部系统中。 有三种类别:
table 0-row-2 1-row-2 2-row-2 3-row-2 类别 描述 身份验证失败 ( AUTH_*)Journey Optimizer无法获取或刷新调用终结点所需的OAuth令牌或凭据。 检查链接到渠道配置的API凭据是否有效且未过期。 请求生成错误 ( REQUEST_GENERATION_ERROR)Journey Optimizer无法构造有效的HTTP请求 — 例如,因为无法解析URL模板或缺少所需的个性化字段。 HTTP分析错误 ( HTTP_PARSE_ERROR)Journey Optimizer收到来自终结点的响应,但无法将其解析为可用的结构。 note tip TIP 预调用失败表示Journey Optimizer端或渠道配置中出现问题,而不是外部端点出现问题。 通过查看API凭据和必需的有效负载字段开始故障排除。 -
平均延迟:所有HTTP调用的平均端到端响应时间(以毫秒为单位),包括成功的调用、错误和超时。
随时间变化的自定义渠道结果 outcomes-overtime
随时间变化的自定义渠道结果图形显示选定时间段内的HTTP调用KPI趋势。 时间序列的粒度取决于所选的时间范围:
- 对于为期7天的报表,每个数据点显示一天的KPI。
- 对于1天的时间范围,此图表显示每小时的KPI。
- 对于1小时时间范围,此图表显示每分钟的KPI。
一段时间内的延迟 latency-overtime
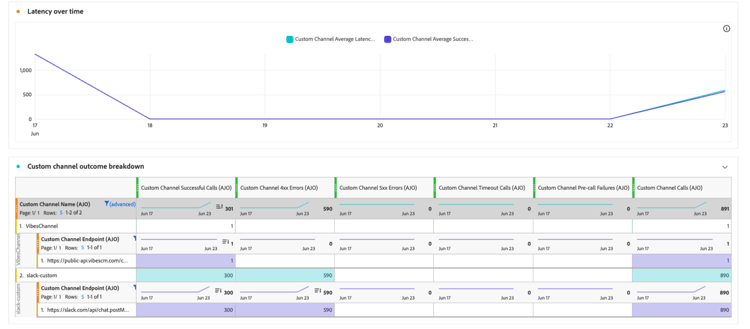
一段时间内的延迟图形可显示所选时段内的延迟量度趋势。 通过这个时间序列视图,您可以跟踪性能模式、识别高峰延迟时段并监视优化或系统更改随时间变化的影响。
自定义渠道结果细分 outcome-breakdown
自定义渠道结果细分表提供了HTTP调用量度的层次细分 — 从最顶层的每个端点的总体量度,到使用该端点的每个自定义渠道的量度,再到最底层依赖它们的营销活动和历程。
延迟细分 latency-breakdown
延迟细分表提供了自定义渠道中延迟量度的详细细分。 此视图可帮助您识别哪些特定端点或通道遇到性能问题,使您能够有效地查明并解决延迟瓶颈。
insight Builder insight-builder
使用 Insight Builder 根据自定义渠道指标创建自定义可视化图表和功能板。 通过此工具,您可以合并多个KPI、应用过滤器以及创建量身定制的视图,以满足您的监控和报告需求。 了解详情
故障排除 troubleshooting
如果您遇到自定义渠道问题,下表列出了常见症状、可能的原因和建议的解决方案。
{{profile.person.name.firstName | default("Valued Customer")}}。This section contains structured knowledge intended to support interpretation, retrieval, and question answering related to this topic.
For complete understanding, this information should be combined with the documentation on this page. Neither source is intended to stand alone; the page describes the feature, while this section provides additional context that helps disambiguate terminology, intent, applicability, and constraints.
- TL;DR: This page explains how to monitor custom channel delivery performance in Journey Optimizer using out-of-the-box campaign and journey reports and the dedicated custom channel monitoring dashboard, and how to troubleshoot common delivery issues.
Intents:
- Monitor custom channel delivery performance through out-of-the-box campaign and journey reports
- Access and use the custom channel monitoring dashboard
- Interpret custom channel metrics such as successful calls, errors, timeouts, and pre-call failures
- Analyze outcomes and latency over time and break them down by endpoint, channel, campaign, and journey
- Troubleshoot common custom channel delivery symptoms and apply recommended resolutions
Glossary:
- Custom channels monitoring dashboard: A dedicated dashboard accessed from Administration > Channels > Channel Builder > Custom channels monitoring that monitors the reliability and performance of the API calls Journey Optimizer makes to external endpoints (product-specific)
- Pre-call failures: Custom channel sends that failed before the HTTP call was ever made to the external endpoint; these occur in Journey Optimizer’s own infrastructure layer and fall into three categories: authentication failures (
AUTH_*), request generation errors (REQUEST_GENERATION_ERROR), and HTTP parse errors (HTTP_PARSE_ERROR) (product-specific) - Timeout calls: Number of calls that failed because they exceeded the maximum response time (product-specific)
- Insight Builder: A tool used to create custom visualizations and dashboards based on custom channel metrics (product-specific)
- Successful deliveries: Messages for which the endpoint returned an HTTP 2xx response (product-specific)
Guardrails:
- Clicks metric tracking requires a subdomain delegated for custom channels.
- Pre-call failures indicate a problem on the Journey Optimizer side or in the channel configuration, rather than an issue with your external endpoint; start troubleshooting by reviewing API credentials and required payload fields.
- Average latency is the average end-to-end response time in milliseconds for all HTTP calls, including successful calls, errors, and timeouts.
- Report granularity depends on the selected time range: a 7-day report shows KPIs per day, a 1-day range shows KPIs per hour, and a 1-hour range shows KPIs per minute.
- HTTP 401/403 errors indicate an authentication failure; update the credentials in Administration > Channels > API credentials.
- HTTP 429 errors indicate the external endpoint is throttling requests; review your endpoint’s rate limits and reduce the throttling setting in the Channel Builder policy configuration.
Terminology:
- Canonical name: Custom channels monitoring dashboard — Acronym: n/a — variants: custom channel monitoring dashboard, Custom channel metrics
- Synonyms: “Attempted deliveries” = total number of messages sent to the external endpoint
- Do not confuse: “Successful deliveries” (report metric: messages for which the endpoint returned an HTTP 2xx response) ≠ “Successful calls” (monitoring metric: total HTTP calls that returned a valid response without error)
- Do not confuse: “4xx/5xx errors” (failed calls due to client-side or server-side errors) ≠ “Timeout calls” (calls that exceeded the maximum response time) ≠ “Pre-call failures” (sends that failed before the HTTP call was made)
FAQ:
- Q: Where can I monitor custom channel performance? — Through out-of-the-box campaign and journey reports and the dedicated custom channel monitoring dashboard, accessed from Administration > Channels > Channel Builder > Custom channels monitoring.
- Q: What does the Clicks metric require? — The Clicks metric counts link clicks tracked in the payload and requires a subdomain delegated for custom channels.
- Q: What are pre-call failures? — Custom channel sends that failed before the HTTP call was ever made to the external endpoint; they occur in Journey Optimizer’s own infrastructure layer and include authentication failures, request generation errors, and HTTP parse errors.
- Q: My calls return HTTP 429 errors. What should I do? — The external endpoint is throttling requests from Journey Optimizer; review your endpoint’s rate limits and reduce the throttling setting in the Channel Builder policy configuration.
- Q: How does the report time granularity change with the time range? — A 7-day report shows one data point per day, a 1-day range shows KPIs per hour, and a 1-hour range shows KPIs per minute.
- Q: How do I troubleshoot unresolved personalization tokens? — Verify the XDM attribute path is correct and add a default value fallback, for example
{{profile.person.name.firstName \| default("Valued Customer")}}.