On this page: Learn how to manage the lifecycle of your custom channels and monitor delivery performance through Adobe Journey Optimizer’s out-of-the-box reporting, including metrics such as successful deliveries, errors, and link clicks.
Once a custom channel is created and activated, you can manage its lifecycle and monitor delivery performance through the Journey Optimizer interface.
Leverage campaign and journey reports reporting
Journey Optimizer provides out-of-the-box reporting for custom channels.
The Custom channel campaign report is detailed in this section.
The following metrics are available for custom channels in both live (24h) and global (CJA) reports.
Learn more about live reports and global reports. For details on reporting functionalities, refer to this documentation.
Monitor delivery performance monitoring
In addition to campaign and journey reports, Journey Optimizer provides a dedicated custom channel monitoring dashboard. Access it from Administration > Channels > Channel Builder > Custom channels monitoring.
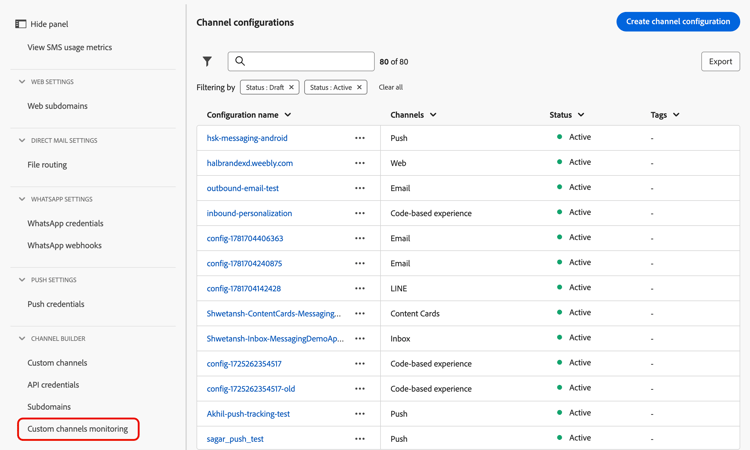
This dashboard lets you monitor the reliability and performance of the API calls Journey Optimizer makes to your external endpoints when delivering custom channel messages. Use it to quickly spot integration issues, latency, and throttling limits.
The Custom channels monitoring dashboard functions like other all-time reports in Journey Optimizer. You can select a time range, filter by channel or endpoint, and drill down to see the campaigns and journeys that rely on each custom channel. Learn more
Custom channel metrics monitoring-kpis
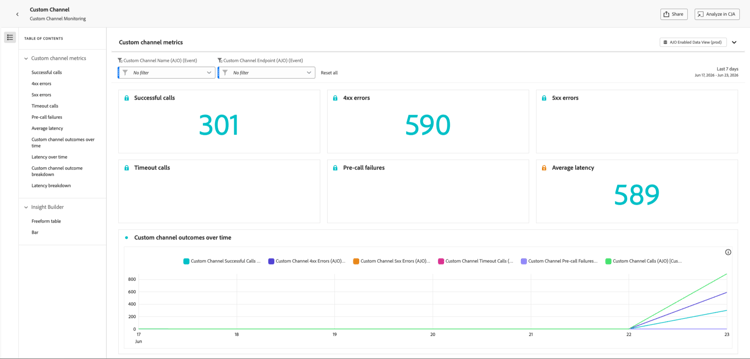
The Custom channel metrics section provides a consolidated view of the operational health and reliability of your custom channel calls.
-
Successful calls: Total number of HTTP calls that returned a valid response without error.
-
4xx/5xx errors: Number of failed calls due to client-side (4xx) or server-side (5xx) errors, highlighting configuration issues or endpoint failures.
-
Timeout calls: Number of calls that failed because they exceeded the maximum response time. This helps surface latency or performance issues with external endpoints.
-
Pre-call failures: Number of custom channel sends that failed before the HTTP call was ever made to the external endpoint. These failures occur in Journey Optimizer’s own infrastructure layer — not in your external system. There are three categories:
table 0-row-2 1-row-2 2-row-2 3-row-2 Category Description Authentication failures ( AUTH_*)Journey Optimizer could not obtain or refresh the OAuth token or credentials needed to call the endpoint. Check that the API credentials linked to the channel configuration are valid and have not expired. Request generation errors ( REQUEST_GENERATION_ERROR)Journey Optimizer could not construct a valid HTTP request — for example, because a URL template could not be resolved or a required personalization field was missing. HTTP parse errors ( HTTP_PARSE_ERROR)Journey Optimizer received a response from the endpoint but could not parse it into a usable structure. note tip TIP Pre-call failures indicate a problem on the Journey Optimizer side or in the channel configuration, rather than an issue with your external endpoint. Start troubleshooting by reviewing your API credentials and required payload fields. -
Average latency: Average end-to-end response time (in milliseconds) for all HTTP calls, including successful calls, errors, and timeouts.
Custom channels outcomes over time outcomes-overtime
The Custom channels outcomes over time graph shows the HTTP call KPI trend over the selected time period. The granularity of the time series depends on the selected time range:
- For a 7-day report, each data point shows the KPIs for one day.
- For a 1-day time range, the graph shows the KPIs per hour.
- For a 1-hour time range, the graph shows the KPIs per minute.
Latency over time latency-overtime
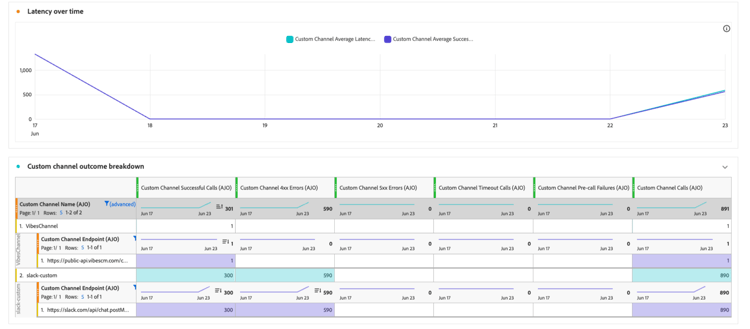
The Latency over time graph visualizes the trend of latency metrics over the selected time period. This time-series view allows you to track performance patterns, identify peak latency periods, and monitor the impact of optimizations or system changes over time.
Custom channel outcome breakdown outcome-breakdown
The Custom channel outcome breakdown table provides a hierarchical breakdown of HTTP call metrics — from overall metrics per endpoint at the top level, to metrics per custom channel using that endpoint, down to the campaigns and journeys that rely on them at the bottom level.
Latency breakdown latency-breakdown
The Latency breakdown table provides a detailed breakdown of latency metrics across your custom channels. This view helps you identify which specific endpoints or channels are experiencing performance issues, enabling you to pinpoint and address latency bottlenecks effectively.
Insight Builder insight-builder
Use the Insight Builder to create custom visualizations and dashboards based on the custom channel metrics. This tool allows you to combine multiple KPIs, apply filters, and create tailored views that align with your monitoring and reporting needs. Learn more
Troubleshooting troubleshooting
If you encounter issues with your custom channel, the following table lists common symptoms, possible causes, and recommended resolutions.
{{profile.person.name.firstName | default("Valued Customer")}}.This section contains structured knowledge intended to support interpretation, retrieval, and question answering related to this topic.
For complete understanding, this information should be combined with the documentation on this page. Neither source is intended to stand alone; the page describes the feature, while this section provides additional context that helps disambiguate terminology, intent, applicability, and constraints.
- TL;DR: This page explains how to monitor custom channel delivery performance in Journey Optimizer using out-of-the-box campaign and journey reports and the dedicated custom channel monitoring dashboard, and how to troubleshoot common delivery issues.
Intents:
- Monitor custom channel delivery performance through out-of-the-box campaign and journey reports
- Access and use the custom channel monitoring dashboard
- Interpret custom channel metrics such as successful calls, errors, timeouts, and pre-call failures
- Analyze outcomes and latency over time and break them down by endpoint, channel, campaign, and journey
- Troubleshoot common custom channel delivery symptoms and apply recommended resolutions
Glossary:
- Custom channels monitoring dashboard: A dedicated dashboard accessed from Administration > Channels > Channel Builder > Custom channels monitoring that monitors the reliability and performance of the API calls Journey Optimizer makes to external endpoints (product-specific)
- Pre-call failures: Custom channel sends that failed before the HTTP call was ever made to the external endpoint; these occur in Journey Optimizer’s own infrastructure layer and fall into three categories: authentication failures (
AUTH_*), request generation errors (REQUEST_GENERATION_ERROR), and HTTP parse errors (HTTP_PARSE_ERROR) (product-specific) - Timeout calls: Number of calls that failed because they exceeded the maximum response time (product-specific)
- Insight Builder: A tool used to create custom visualizations and dashboards based on custom channel metrics (product-specific)
- Successful deliveries: Messages for which the endpoint returned an HTTP 2xx response (product-specific)
Guardrails:
- Clicks metric tracking requires a subdomain delegated for custom channels.
- Pre-call failures indicate a problem on the Journey Optimizer side or in the channel configuration, rather than an issue with your external endpoint; start troubleshooting by reviewing API credentials and required payload fields.
- Average latency is the average end-to-end response time in milliseconds for all HTTP calls, including successful calls, errors, and timeouts.
- Report granularity depends on the selected time range: a 7-day report shows KPIs per day, a 1-day range shows KPIs per hour, and a 1-hour range shows KPIs per minute.
- HTTP 401/403 errors indicate an authentication failure; update the credentials in Administration > Channels > API credentials.
- HTTP 429 errors indicate the external endpoint is throttling requests; review your endpoint’s rate limits and reduce the throttling setting in the Channel Builder policy configuration.
Terminology:
- Canonical name: Custom channels monitoring dashboard — Acronym: n/a — variants: custom channel monitoring dashboard
- Report metric “Attempted deliveries”: total number of messages sent to the external endpoint
- Do not confuse: “Successful deliveries” (report metric: messages for which the endpoint returned an HTTP 2xx response) ≠ “Successful calls” (monitoring metric: total HTTP calls that returned a valid response without error)
- Do not confuse: “4xx/5xx errors” (failed calls due to client-side or server-side errors) ≠ “Timeout calls” (calls that exceeded the maximum response time) ≠ “Pre-call failures” (sends that failed before the HTTP call was made)
FAQ:
- Q: Where can I monitor custom channel performance? — Through out-of-the-box campaign and journey reports and the dedicated custom channel monitoring dashboard, accessed from Administration > Channels > Channel Builder > Custom channels monitoring.
- Q: What does the Clicks metric require? — The Clicks metric counts link clicks tracked in the payload and requires a subdomain delegated for custom channels.
- Q: What are pre-call failures? — Custom channel sends that failed before the HTTP call was ever made to the external endpoint; they occur in Journey Optimizer’s own infrastructure layer and include authentication failures, request generation errors, and HTTP parse errors.
- Q: My calls return HTTP 429 errors. What should I do? — The external endpoint is throttling requests from Journey Optimizer; review your endpoint’s rate limits and reduce the throttling setting in the Channel Builder policy configuration.
- Q: How does the report time granularity change with the time range? — A 7-day report shows one data point per day, a 1-day range shows KPIs per hour, and a 1-hour range shows KPIs per minute.
- Q: How do I troubleshoot unresolved personalization tokens? — Verify the XDM attribute path is correct and add a default value fallback, for example
{{profile.person.name.firstName | default("Valued Customer")}}.