On this page: Learn how to navigate the Adobe Journey Optimizer license usage dashboard and troubleshoot unexpected increases in your Engageable Profiles count.
The Adobe Journey Optimizer user interface provides a dashboard that displays important information about your organization’s license usage, as captured during a daily snapshot.
To access this dashboard, go to Administration > License Usage. This opens the Overview tab, which displays the dashboard.
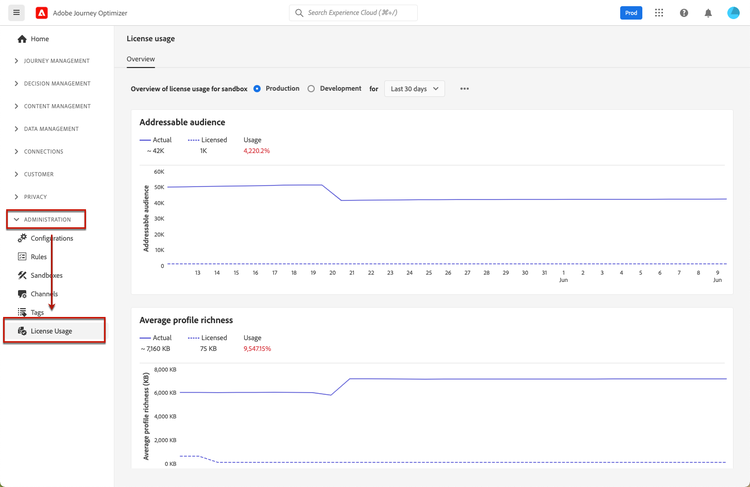
-
To view the dashboard, you must have the View License Usage Dashboard permission.
-
Certain metrics (e.g., compute hours, emails) are not displayed for development sandboxes, as indicated by
N/Ain the quota column. Only non-null values are displayed in the dashboard: when metrics are zero or close to zero, they are not populated.
For Adobe Journey Optimizer, the dashboard allows you to check the number of Engageable Profiles — unique profiles engaged through journeys, campaigns, or decisioning over a rolling 12-month window. For a full explanation of how Engageable Profiles are defined and calculated, see Engageable Profiles and license usage.
Troubleshooting: significant increase in engageable profiles count troubleshooting-engageable-profiles
If you observe a sudden spike in the Engageable Profiles count (for example, profiles increasing from hundreds of thousands to millions within a day), this section provides guidance to understand and address the issue.
Understanding the increase
The Engageable Profiles metric reflects the number of unique profiles engaged by journeys or campaigns over the past 12 months. A sudden increase may result from:
- Large audiences being targeted by new journeys or campaigns
- Changes in datasets enabled for Profile Service
- Batch processing of audiences that haven’t been engaged recently
Resolution steps
To address this issue, follow these steps:
-
Understand profile counting logic:
- Engageable Profiles are calculated based on unique profiles engaged by journeys or campaigns over the past 12 months.
- If a profile enters multiple journeys, it is counted as one Engageable Profile for that sandbox.
- The metric cannot decrease unless there is no engagement with certain profiles for over 12 months or if pseudonymous profiles are stitched to known ones.
- Engageable Profiles are calculated using a customer’s Addressable Audience.
- The audience engaged in the past 12 months using any of the Journey Optimizer’s capabilities, out of the total Addressable Audience, determines the count of Engageable Profiles.
-
Investigate journeys, campaigns and decisioning targeting large audiences:
- Review recent journeys and campaigns targeting large numbers of profiles using Engageable Profiles queries or Query Service.
- Identify specific journey versions that contributed to the spike in profile counts.
- Journeys, Campaigns and Decisioning involving new profiles are likely to lead to an increase in event counts in the Journeys datasets, contributing to the rise in the Engageable Profiles count.
-
Filter audiences at journey and campaigns level:
- Apply filters at the audience level before initiating journeys or campaigns to prevent unnecessary increases in Engageable Profiles.
- Ensure only relevant audiences are targeted during engagements.
-
Reduce addressable audience size:
- Delete pseudonymous profiles if necessary. Note that this action affects both Journey Optimizer and Real-Time Customer Data Platform.
- Learn more about Pseudonymous Profile data expiration in Real-Time Customer Profile Guide.
- Note: Pseudonymous Profile data expiration cannot be configured through the Platform UI or APIs. You must contact support to enable this feature.
-
Monitor dataset changes:
- Verify datasets enabled for profiling and ensure they do not contain excessive ECIDs (Experience Cloud IDs).
- If needed, delete datasets with high ECID counts and recreate them with reduced records.
-
Develop a long-term reduction strategy:
- The Engageable Profiles count will naturally decrease if certain profiles remain unengaged for more than 12 months.
See also:
- Engageable Profiles query examples - Sample queries to monitor and analyze your Engageable Profiles
- Adobe Experience Platform Query Service overview
Related documentation related-documentation
Learn more in the Adobe Experience Platform documentation:
This section contains structured knowledge intended to support interpretation, retrieval, and question answering related to this topic.
For complete understanding, this information should be combined with the documentation on this page. Neither source is intended to stand alone; the page describes the feature, while this section provides additional context that helps disambiguate terminology, intent, applicability, and constraints.
- TL;DR: The License usage dashboard in Adobe Journey Optimizer displays your organization’s license usage from a daily snapshot, centered on the Engageable Profiles metric, and provides guidance to troubleshoot sudden increases in that count.
Intents:
- Navigate the license usage dashboard from Administration > License Usage
- Check the number of Engageable Profiles engaged over a rolling 12-month window
- Understand why the Engageable Profiles count may suddenly increase
- Follow the resolution steps to address a spike in Engageable Profiles
Glossary:
- License usage dashboard: A dashboard displaying important information about your organization’s license usage, captured during a daily snapshot (product-specific)
- Engageable Profiles: Unique profiles engaged through journeys, campaigns, or decisioning over a rolling 12-month window (product-specific)
- Addressable Audience: The total audience used to calculate Engageable Profiles (product-specific)
Guardrails:
- To view the dashboard, you must have the View License Usage Dashboard permission.
- Certain metrics (for example compute hours, emails) are not displayed for development sandboxes and are shown as
N/Ain the quota column. - Only non-null values are displayed; when metrics are zero or close to zero they are not populated.
- The Engageable Profiles metric cannot decrease unless there is no engagement with certain profiles for over 12 months, or if pseudonymous profiles are stitched to known ones.
- Pseudonymous Profile data expiration cannot be configured through the Platform UI or APIs; you must contact support to enable this feature.
- Deleting pseudonymous profiles affects both Journey Optimizer and Real-Time Customer Data Platform.
Terminology:
- Canonical name: License usage dashboard — menu: License Usage
- Do not confuse: “Engageable Profiles” (unique profiles engaged through journeys, campaigns, or decisioning) ≠ “Addressable Audience” (the total audience the count is calculated from)
FAQ:
- Q: Where do I access the license usage dashboard? — Go to Administration > License Usage, which opens the Overview tab displaying the dashboard.
- Q: What permission do I need to view the dashboard? — The View License Usage Dashboard permission.
- Q: What can cause a sudden spike in the Engageable Profiles count? — Large audiences targeted by new journeys or campaigns, changes in datasets enabled for Profile Service, or batch processing of audiences not engaged recently.
- Q: Can the Engageable Profiles count decrease? — Only if certain profiles have no engagement for over 12 months, or when pseudonymous profiles are stitched to known ones.
- Q: Why are some metrics shown as N/A? — Certain metrics such as compute hours and emails are not displayed for development sandboxes.