Get started analyzing data with Coworker Chat
Set up Adobe CX Enterprise Coworker Chat to analyze your Customer Journey Analytics data views or Adobe Analytics report suites, then follow a working example. For an overview of what you can do with Coworker Chat, including use cases, skills, and best practices, see Analyze data with Coworker Chat.
Before you begin, learn the Coworker Chat interface and configuration options, then ensure Coworker is connected to Customer Journey Analytics or Adobe Analytics and the relevant data views or report suites.
Before you begin
Data access and permissions
Coworker Chat inherits permissions from Customer Journey Analytics or Adobe Analytics. You can access only those data views, report suites, dimensions, metrics, and segments available to you in Analysis Workspace.
Interface and configuration options
Before you use Coworker Chat with your Customer Journey Analytics or Adobe Analytics data, learn how to sign in and manage configuration options for the following features:
- Chat inputs
- Conversations
- Marketplaces
- MCP servers
- Memory
- Plugins
- Skills
- And more
For more information, see the Coworker Chat UI guide.
Verify your analytics integrations
Coworker Chat connects to Customer Journey Analytics and Adobe Analytics through integrations. Before you start, make sure that the integration for your product is connected.
-
In Coworker, select Customizations in the left rail.
-
Select the Integrations tab, then make sure that cja-mcp and aa-mcp is available in your list of connected MCP servers. Use the search field to quickly filter the list of available integrations.

-
(Conditional) If the integration isn’t listed, select Add server to add it. For more information, see Connect MCP servers in the Coworker Chat UI guide.
Connect to the right data view or report suite
A data view is a container in Customer Journey Analytics that determines how data is interpreted. A report suite is a container in Adobe Analytics that holds the data collected from your sites and apps.
You might have access to various data views in Customer Journey Analytics or report suites in Adobe Analytics. Each might contain different dimensions and metrics that Coworker can use when analyzing data.
Decide which data views or report suites you want to use
Tell Coworker the types of questions you want answered, and ask it which data views or report suites you have access to that provide that information. You can also set your data view or report suite as a preference in memory.
You:
I’m interested in learning where customers drop off in the customer journey. Which data views in Customer Journey Analytics do I have access to that would be able to answer this question for me?
Coworker Chat response:
You have access to three data views. The Customer lifecycle data view contains the following dimensions and metrics, which would be best for answering your question.
You:
Great, let’s use that data view.
Coworker Chat response:
Okay, I’ll use the Customer lifecycle data view to answer future questions in this chat session.
Add a data view or report suite preference in Memory
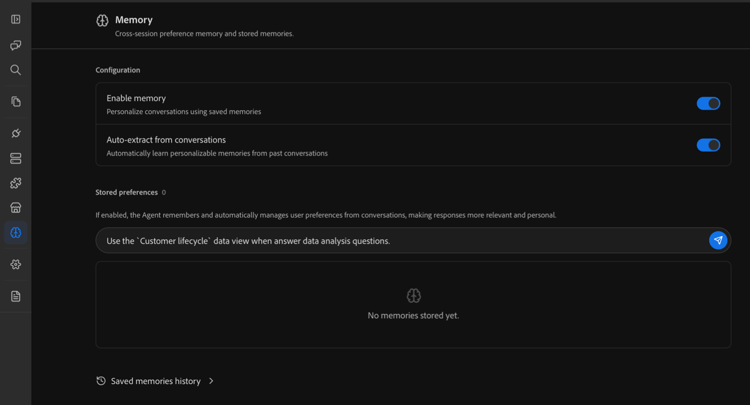
Coworker Chat contains a memory feature that allows you to provide it with access to information that spans across all chats. It’s a good practice to add your preferred data views or report suites as preferences in Coworker’s memory.
-
In Coworker Chat, in the left nav, select the Memory icon.
-
On the Memory page, in the Stored preferences section, specify one or more data views or report suites that you want Coworker Chat to use in your chats.
Example: Find where customers drop off
You can ask Coworker Chat to use your data to analyze any business question.
For example, as a marketing manager, merchandiser, or growth lead, you might want to understand where customers abandon the path to purchase, why they did, and what can be done to drive higher conversion rates.
The types of questions you can ask
You don’t need to know what a “fallout visualization” is, or which metric goes in which slot. Instead, describe the outcome you care about in plain language:
- “Where are we losing people on the way to purchase?”
- “What’s my full conversion funnel, from product view to checkout?”
- “Which marketing channels leak the most between cart and purchase?”
- “Is cart abandonment worse on mobile or desktop?”
- “Do people from paid social convert differently than people from email?”
The conversation
1. Start with the business question
You:
Where are we losing people on the way to purchase?
Coworker Chat response:
Notice that Coworker Chat chooses the right visualization, sequences the touchpoints, and even adds recommended next steps.
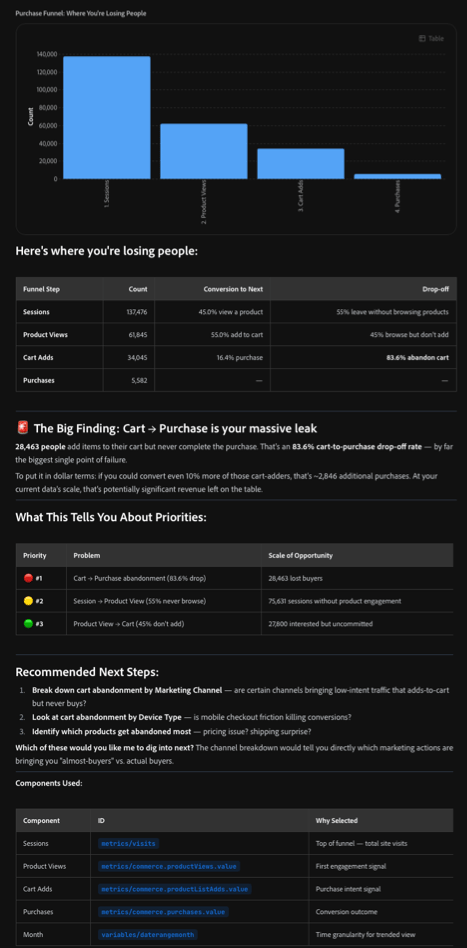
This is a funnel question — let me run the conversion funnel to see where drop-off happens on the path to purchase.
Here’s where you’re losing people:
The big finding: cart to purchase is your biggest leak
28,463 people add items to their cart but never complete the purchase. That’s an 83.6% cart-to-purchase drop-off rate — by far the largest single point of failure.
What this tells you about priorities:
Recommended next steps:
- Break down cart abandonment by marketing channel — are certain channels bringing low-intent traffic that adds to cart but never buys?
- Look at cart abandonment by device type — is mobile checkout friction killing conversions?
- Identify which products get abandoned most — pricing issue? Shipping surprise?
Which of these would you like me to dig into next? The channel breakdown would tell you directly which marketing actions are bringing you “almost-buyers” versus actual buyers.
2. Drill into the leak
You:
Okay, let’s break down by marketing channel
Coworker Chat response:

There’s a custom Marketing Channel dimension. Let me pull the funnel by that, then calculate the per-channel conversion rates and identify where each channel leaks.
The verdict: the leak is not channel-specific
This is a really revealing finding. Here’s the per-channel funnel breakdown:
Key takeaways:
- The cart-to-purchase drop-off is uniformly bad across all channels (83-84%). This means the problem isn’t about traffic quality — every channel is converting people into the cart at similar rates. The leak is in your checkout experience itself, not your marketing.
- No channel is significantly better or worse at converting. Overall conversion rates cluster tightly between 3.8% and 4.2%, and revenue per session is nearly identical ($495-$512).
- Where the volume impact matters most: paid search loses the most people in absolute terms (9,015 cart abandonments), followed by organic search (6,449 lost). These are the biggest dollar-value opportunities because they drive the most traffic.
What this tells you strategically
The marketing channels are doing their job — they’re all getting people interested and adding to cart at similar rates. The problem is downstream of marketing: your checkout and payment flow is where the money is leaking.
Recommended next investigations:
- Break down mobile cart abandonment by product category — is it worse for high-price items (suggesting mobile payment trust issues)?
- Look at which marketing channels drive the most mobile traffic — are you spending paid media dollars to send people into a broken mobile funnel?
- Check if there’s a page or site-section signal — can we see which checkout pages mobile users hit last before abandoning?
Which angle would you like to explore next?
3. Keep investigating
You:
Interesting. Let’s try breaking down by device type.
Coworker Chat response:
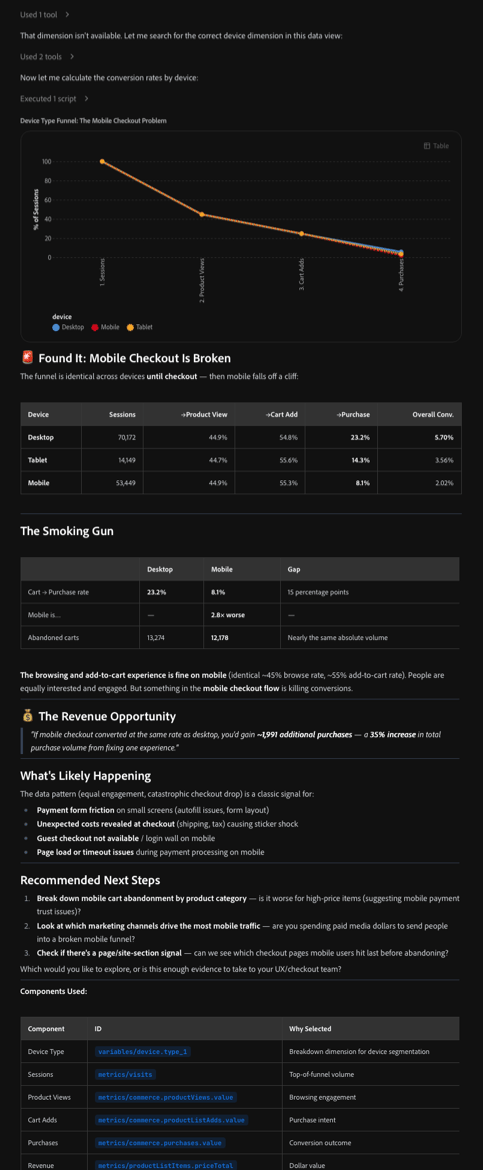
Found it: mobile checkout is broken
The funnel is identical across devices until checkout — then mobile falls off a cliff:
The smoking gun
The browsing and add-to-cart experience is fine on mobile (identical ~45% browse rate, ~55% add-to-cart rate). People are equally interested and engaged. But something in the mobile checkout flow is killing conversions.
The revenue opportunity
If mobile checkout converted at the same rate as desktop, you’d gain ~1,991 additional purchases — a 35% increase in total purchase volume from fixing one experience.
What’s likely happening
The data pattern (equal engagement, catastrophic checkout drop) is a classic signal for:
- Payment form friction on small screens (autofill issues, form layout)
- Unexpected costs revealed at checkout (shipping, tax) causing sticker shock
- Guest checkout not available or a login wall on mobile
- Page load or timeout issues during payment processing on mobile
Recommended next steps:
- Break down mobile cart abandonment by product category — is it worse for high-price items (suggesting mobile payment trust issues)?
- Look at which marketing channels drive the most mobile traffic — are you spending paid media dollars to send people into a broken mobile funnel?
- Check if the “holiday_flash_sale” campaign had better checkout conversion — urgency-driven campaigns might overcome checkout friction
Which would you like to explore, or is this enough evidence to take to your UX and checkout team?
4. Turn it into a decision
You:
So what should I do?
Coworker Chat response:
Based on what the data shows, here’s where I’d focus:
- Fix the mobile checkout — it’s not a channel problem. Every channel is converting people into the cart at a similar, healthy rate, so the ad spend is working across the board. The revenue is being lost specifically in the mobile checkout flow, which is where the fix belongs.
- Start with payment and form friction. These are the most common reasons high-intent mobile shoppers abandon a cart. Offering mobile wallet options and shortening the form are usually the fastest wins.
- Re-check after the fix. Once checkout changes ship, watch whether mobile’s cart-to-purchase rate moves toward the desktop rate of 23.2%.
Want me to save this as a project so you can track it, or set an alert if mobile cart-to-purchase drops below a threshold?
What happened
In four plain-language questions, Coworker helped us:
- Build a multi-step conversion funnel and flag cart-to-purchase as the biggest leak
- Rule out marketing channel as the cause — every channel leaked at nearly the same rate
- Isolate the real problem to mobile checkout, and quantify the fix at a 35% lift in purchases
- Walk away with a specific fix to prioritize: mobile payment and form friction. This is benchmarked against desktop’s 23.2% conversion rate
Open a visualization in Analysis Workspace
After Coworker creates a visualization, you can open it in Analysis Workspace for deeper analysis and granular control. The visualization opens in a new Analysis Workspace project in Customer Journey Analytics or Adobe Analytics, depending on the source of the data.
To open a visualization in a new Analysis Workspace project:
-
Next to any visualization that is created in Coworker, select one of the following:
- Analyze in CJA for a visualization based on a Customer Journey Analytics data view
- Analyze in Analysis Workspace for a visualization based on an Adobe Analytics report suite
-
With the visualization open in Analysis Workspace, you can use the drag-and-drop browser interface to make modifications, further craft your analysis, and much more. In Customer Journey Analytics, you can also create an audience.
-
(Optional) Share your Workspace project with anyone you choose.
For more information about Analysis Workspace, see Analysis Workspace overview in the Customer Journey Analytics documentation or Analysis Workspace overview in the Adobe Analytics documentation.
Next steps
For more use cases, the skills that Coworker Chat uses to analyze your data, and best practices for writing prompts, see Analyze data with Coworker Chat.