Surface campaign insights without building reports
Select to zoom.
Campaign analysis that once required building reports in a separate tool is now a conversation. This walkthrough shows how to connect an AI client to Customer Journey Analytics (CJA) and ask performance questions in plain language. The result is faster time to insight, with no manual report building required.
Each step shows one representative prompt and an example AI response. A More you can accomplish section follows for additional exploration in the same session.
Before you begin
The fastest way to get these answers is CX Enterprise Coworker, which requires no server setup or AI client configuration. Try CX Enterprise Coworker
If you’d rather connect your own AI client directly to Customer Journey Analytics, see the tabs below.
Connect the Customer Journey Analytics MCP Server as a custom connector.
- Go to Settings > Integrations in Claude.ai.
- Select Add custom connector and enter the server URL:
https://cja-mcp.adobe.io/mcp - Select Connect and sign in with your Adobe ID.
Full setup: Claude.ai Custom Connectors documentation
Connect the Customer Journey Analytics MCP Server using ChatGPT Developer Mode (Pro, Plus, Business, Enterprise, or Education plan required).
- Enable Developer Mode in ChatGPT Settings.
- Go to Settings > Integrations and select Add custom connector > Remote MCP server.
- Enter the server URL:
https://cja-mcp.adobe.io/mcp - Select Connect and sign in with your Adobe ID.
Full setup: ChatGPT MCP documentation
Using Gemini, Microsoft Copilot, Cursor, Claude Code, or another MCP-compatible environment? Connect to the Customer Journey Analytics MCP Server using this endpoint:
| code language-none |
|---|
|
Full setup instructions for all supported clients: Connect to your AI client
Step 1: Discover available data views
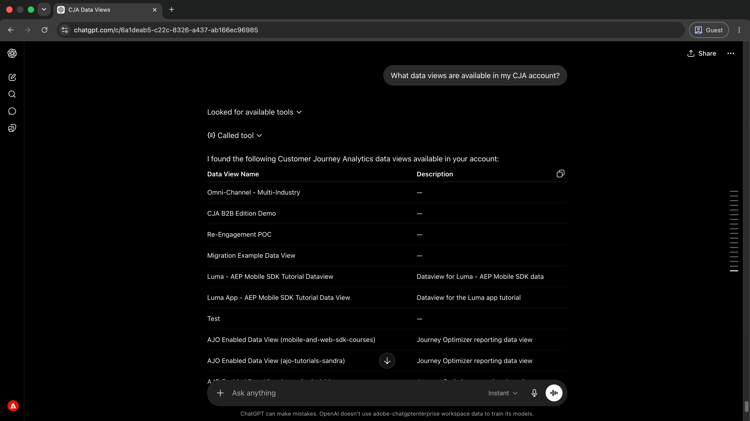
Start by asking your AI client to list the data views available in your CJA account. This tells you which data sets you can query before running any reports.
What data views are available in my CJA account?
Select to zoom.
Step 2: Pull campaign performance data
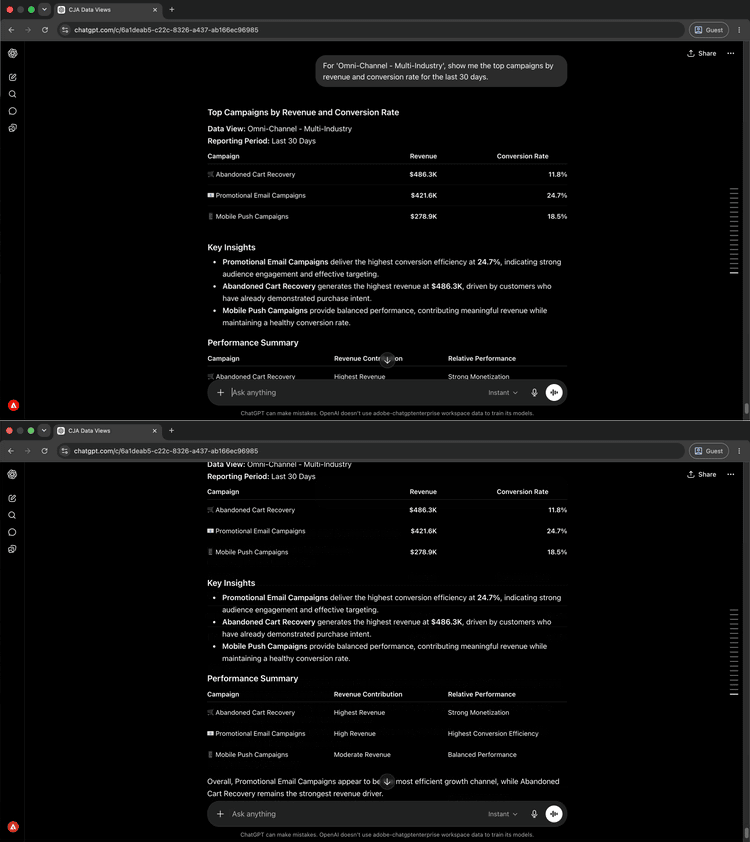
With a data view identified, ask for campaign performance by revenue and conversion rate. The AI resolves metric and dimension names from the data view without requiring technical IDs.
For '[data view name]', show me the top campaigns by revenue and conversion rate for the last 30 days.
Select to zoom.
[data view name] with the name of your data view from step 1. Cross-check results in Analysis Workspace using the same data view and date range before sharing with stakeholders.Step 3: Identify what is driving performance
Ask your AI client to explain what is driving the performance differences across campaign groups. This moves from headline numbers to the variables underneath.
What factors are driving the results for these campaign groups?

Select to zoom.
Step 4: Drill into a specific campaign type
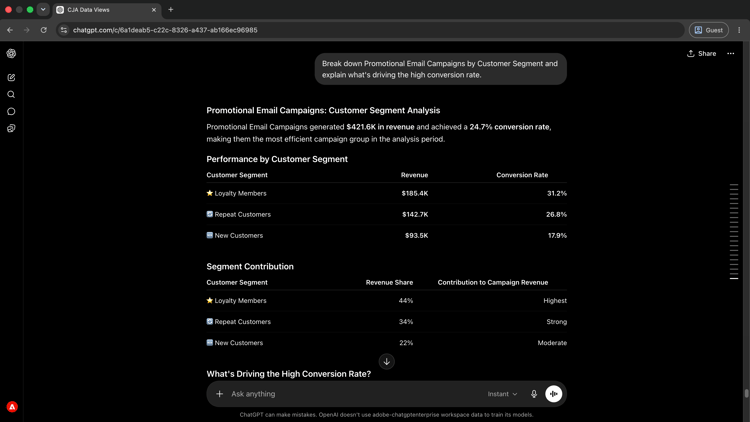
Follow up on a specific finding by asking for a segment-level breakdown. This reveals which customer types are driving performance within a campaign type.
Break down Promotional Email Campaigns by Customer Segment and explain what's driving the high conversion rate.
Select to zoom.
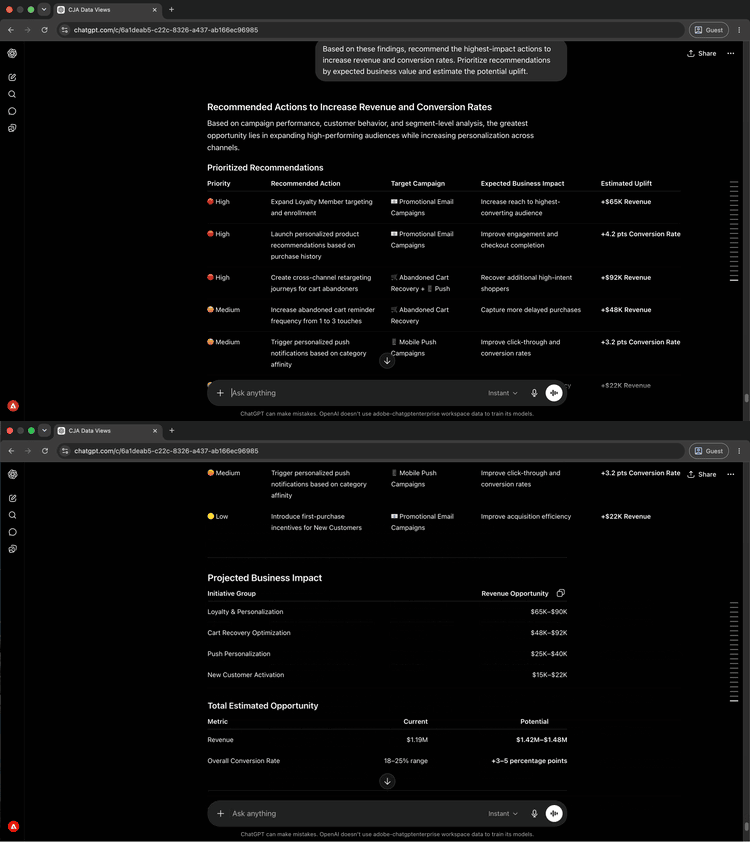
Step 5: Take action on what you found
Ask for prioritized recommendations based on everything surfaced in the session. Requesting business value estimates helps you decide where to act first.
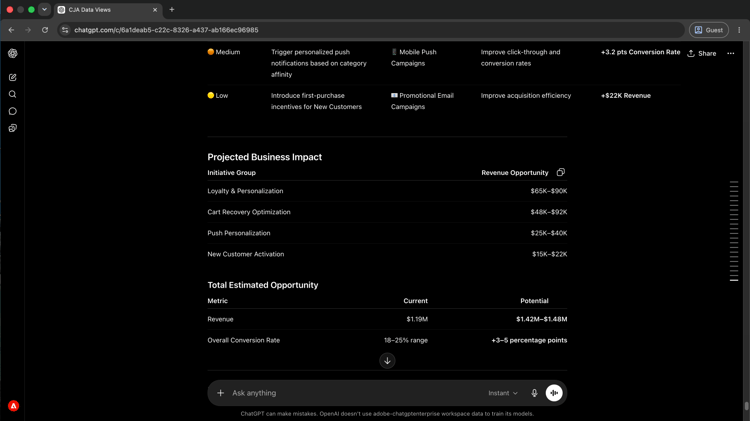
Based on these findings, recommend the highest-impact actions to increase revenue and conversion rates. Prioritize recommendations by expected business value and estimate the potential uplift.
Select to zoom.
What you accomplished
You connected an AI client to Customer Journey Analytics and moved from data view discovery to prioritized business recommendations in five prompts. You identified top campaigns by revenue and conversion rate, surfaced the factors driving performance across campaign groups, drilled into segment-level detail for a specific campaign type, and received ranked recommendations with estimated uplift. This approach replaces report-building with a direct conversation, reducing the time between a business question and a data-backed action plan.
More you can accomplish
The Customer Journey Analytics MCP Server can surface far more insights than the walkthrough covers. Expand a scenario below to see prompts you can try in the same session.
A quick picture of which campaigns are delivering and which are not helps you focus effort before reviewing any detailed reports. These prompts give you that picture in one session.
Prompts
| code language-none |
|---|
|
| code language-none |
|---|
|
| code language-none |
|---|
|
| code language-none |
|---|
|
| code language-none |
|---|
|
Headline metrics tell you what happened. These prompts help you understand why: which segments, channels, and touchpoints are behind the numbers.
Prompts
| code language-none |
|---|
|
| code language-none |
|---|
|
| code language-none |
|---|
|
| code language-none |
|---|
|
| code language-none |
|---|
|
Knowing where performance is strong is only half the picture. These prompts help you identify where you can invest more, which audiences have headroom, and which campaigns are ready to scale.
Prompts
| code language-none |
|---|
|
| code language-none |
|---|
|
| code language-none |
|---|
|
| code language-none |
|---|
|
CJA tools can create segments, audiences, calculated metrics, and Workspace projects directly in CJA without leaving your AI session. Use these prompts to act on what you found.
Prompts
| code language-none |
|---|
|
| code language-none |
|---|
|
| code language-none |
|---|
|
| code language-none |
|---|
|