在此页面上:监视您的历程对第三方系统发出的API调用的可靠性和性能,以便快速发现集成问题、延迟和限制限制。
自定义操作报告页面允许您监视从历程到第三方系统的API调用的可靠性和性能。 这些报告可帮助您快速识别可能影响投放的集成问题、延迟瓶颈或限制/上限限制。
“自定义操作”报表页面的功能与Journey Optimizer中的其他实时报表类似。 有关仪表板功能的详细信息,请参阅本文档。
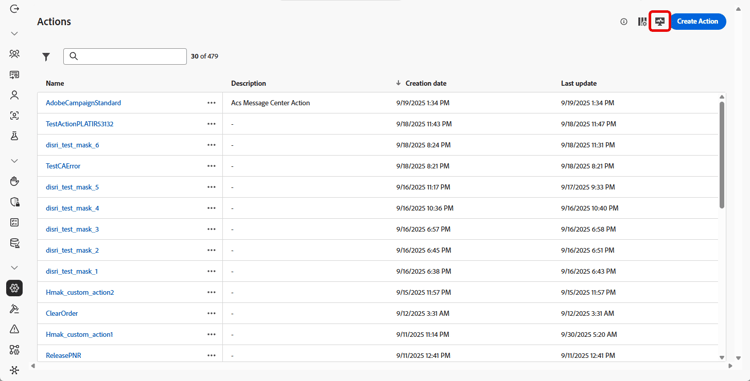
要访问 自定义操作 报告页面,请从您的 操作 主页中单击

除了 自定义操作 报告页面之外,您还可以使用 Adobe Experience Platform Query Service 生成查询以报告自定义操作性能指标。 此节中提供了查询示例。
KPI kpis
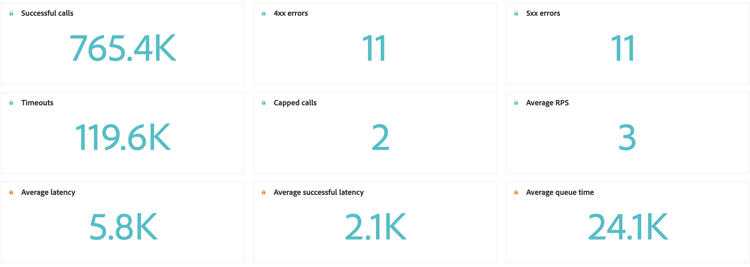
自定义操作关键绩效指标(KPI)用作集中式仪表板,提供自定义操作调用的运行状况和可靠性的综合视图。 这些指标允许您评估性能、发现瓶颈并确保与外部系统的稳定集成。
-
成功的调用:返回有效响应且无错误的HTTP调用总数。
-
4xx/5xx错误:由于客户端(4xx)或服务器端(5xx)错误,突出显示配置问题或终结点故障而失败的调用数。
-
超时:因超出最大响应时间而失败的调用数。 这有助于显示外部端点的滞后或性能问题。
-
上限调用:由于上限限制而被阻止的调用数,可确保下游系统不会过载。
-
平均RPS:在所选时间范围内,自定义操作每秒处理的请求数。
-
平均延迟:所有HTTP调用的平均端到端响应时间(以毫秒为单位),包括成功的调用、错误和超时。
-
平均成功延迟:仅成功调用的平均端到端响应时间(以毫秒为单位),不包括失败的请求和超时。
-
平均队列时间:呼叫在发送之前在执行队列中等待的平均时间(以毫秒为单位)。 这仅适用于受限制的端点,当达到吞吐量限制时,Journey Optimizer会将调用排入队列。
随时间变化的呼叫 calls
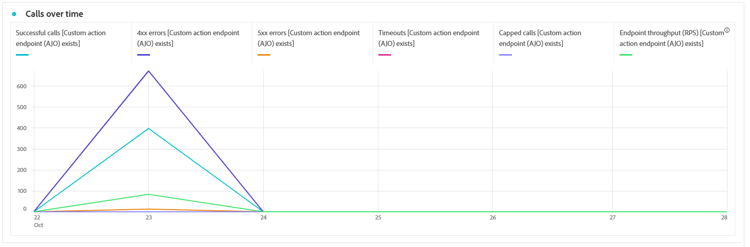
随时间变化的调用图形显示了在为报告选择的时间段内的HTTP调用KPI趋势。 时间序列的粒度取决于所选的时间范围。 例如:
- 对于7天的报告,每个数据点都将显示一天的KPI。
- 如果您选择1天时间范围,该图表将显示每小时的KPI。
- 如果您选择1小时时间范围,该图表将显示每分钟的KPI。
一段时间内的延迟 latency-overtime
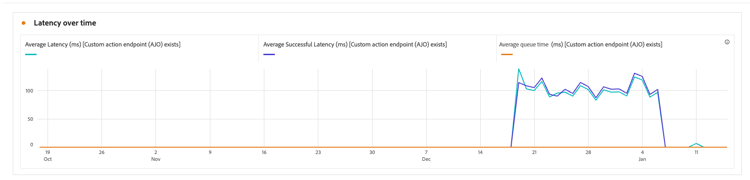
一段时间内的延迟图形可显示所选时段内的延迟量度趋势。 通过这个时间序列视图,您可以跟踪性能模式、识别高峰延迟时段并监视优化或系统更改随时间变化的影响。
呼叫细分 breakdown
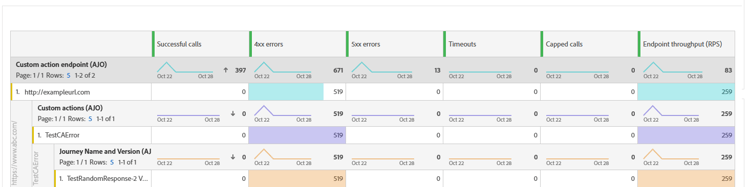
调用细分表提供了HTTP调用量度的层次细分,从顶级的每个端点的总体量度,到使用每个端点的每个自定义操作的量度,再到底层依赖这些量度的历程。
延迟细分 latency-breakdown
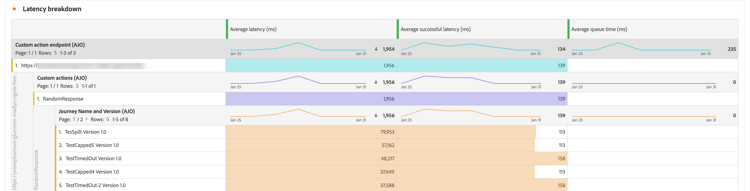
延迟细分表提供了自定义操作中延迟量度的详细细分。 此视图可帮助您识别哪些特定端点或操作遇到性能问题,使您能够有效地查明并解决延迟瓶颈。
操作方法视频 video
以下视频介绍了如何监控从您的旅程到第三方系统的API调用的可靠性和性能。
This section contains structured knowledge intended to support interpretation, retrieval, and question answering related to this topic.
For complete understanding, this information should be combined with the documentation on this page. Neither source is intended to stand alone; the page describes the feature, while this section provides additional context that helps disambiguate terminology, intent, applicability, and constraints.
- TL;DR: This page explains how to use the Custom action reporting page to monitor the reliability and performance of the API calls your journeys make to third-party systems.
Intents:
- Access the Custom action reporting page from the Actions homepage
- Review the Custom action KPIs for operational health and reliability
- Track HTTP call KPI trends over time with the Calls over time graph
- Analyze latency patterns with the Latency over time graph
- Drill into metrics per endpoint, custom action, and journey with the breakdown tables
Glossary:
- Custom action reporting page: The reporting page that lets you monitor the reliability and performance of API calls made from your journeys to third-party systems; it functions like other All-time reports (product-specific)
- Capped calls: Number of calls that were blocked due to capping limits, ensuring downstream systems are not overloaded (product-specific)
- Average queue time: Average time (in milliseconds) calls spent waiting in the execution queue before being sent (product-specific)
- Calls breakdown: A hierarchical table breaking metrics down from per endpoint, to per Custom Action using each endpoint, to the journeys that rely on them (product-specific)
Guardrails:
- Average queue time only applies to throttled endpoints, where Journey Optimizer queues up calls when the throughput limit is reached.
- Average latency covers all HTTP calls, including successful calls, errors, and timeouts, while Average successful latency covers successful calls only, excluding failed requests and timeouts.
- The granularity of the Calls over time series depends on the selected time range: a 7 day report shows KPIs per day, a 1-day time range shows KPIs per hour, and a 1-hour time range shows KPIs per minute.
Terminology:
- Canonical name: Custom action reporting page — Acronym: n/a — variants: Custom action report
- Synonyms: “Average RPS” = “requests per second processed by the custom action over the selected time range”
- Do not confuse: “4xx/5xx errors” (failed calls due to client-side or server-side errors) ≠ “Timeouts” (calls that exceeded the maximum response time) ≠ “Capped calls” (calls blocked due to capping limits)
- Do not confuse: “Average latency” (all HTTP calls) ≠ “Average successful latency” (successful calls only)
FAQ:
- Q: What does the Custom action reporting page monitor? — It monitors the reliability and performance of API calls made from your journeys to third-party systems, helping you identify integration issues, latency bottlenecks, or throttling and capping limits.
- Q: How do I access the Custom action reporting page? — Click the Monitoring icon from your Actions homepage.
- Q: What is the difference between Average latency and Average successful latency? — Average latency is the average response time for all HTTP calls including successful calls, errors, and timeouts, while Average successful latency is for successful calls only, excluding failed requests and timeouts.
- Q: When does Average queue time apply? — It only applies to throttled endpoints, where Journey Optimizer queues up calls when the throughput limit is reached.
- Q: Can I report on custom action performance outside this page? — Yes, you can use Adobe Experience Platform Query Service to build queries on custom action performance metrics.