このページでは、受信データの正常性をAdobe Journey Optimizerで監視します。グラフは、Data Management > Monitoring > Edgeで利用できます。
監視 ワークスペースには、次のタブが含まれています。
EdgeでのJourney Optimizer データのモニター
次のグラフは、Data Management > Monitoring > Edgeで使用できます。
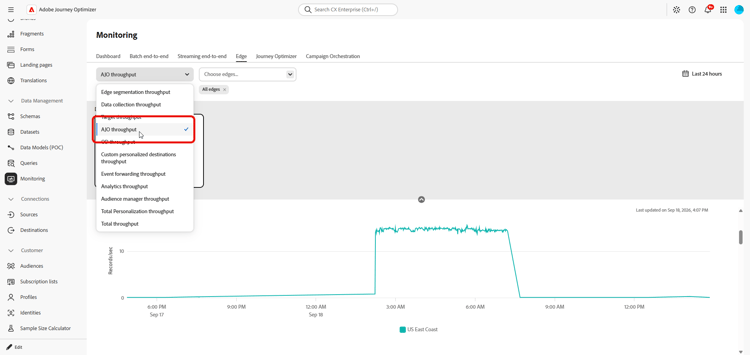
ドロップダウンメニューから、AJO スループットを選択します。
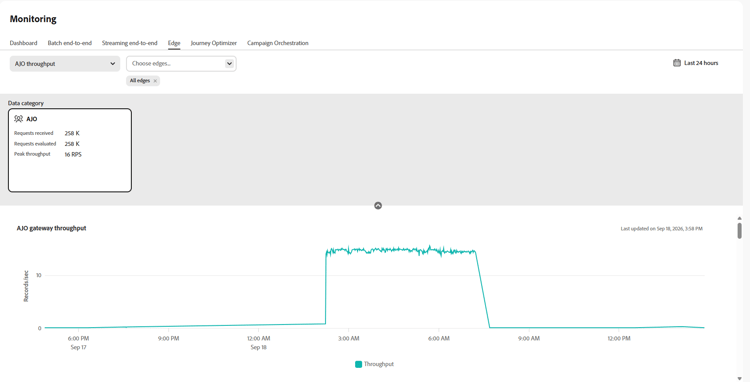
AJO Gateway スループット gateway-throughput
AJO Gateway Throughput グラフは、Journey Optimizer ゲートウェイによって処理された1秒あたりのレコードの合計数を示します。 この指標は、ゲートウェイによって処理されるインバウンドリクエストの全体的な量を監視するために使用します。
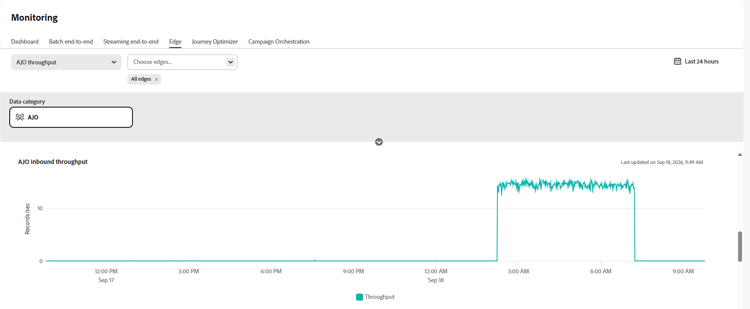
AJO インバウンドスループット inbound-throughput
AJO Inbound Throughput グラフは、1秒間に受信されたインバウンドレコードの合計数を示します。 この指標は、インバウンドレコードがEdge サービスに到達する割合を測定します。 このグラフは、インバウンドデータ量の確認とトラフィックレベルの変化の特定に使用できます。
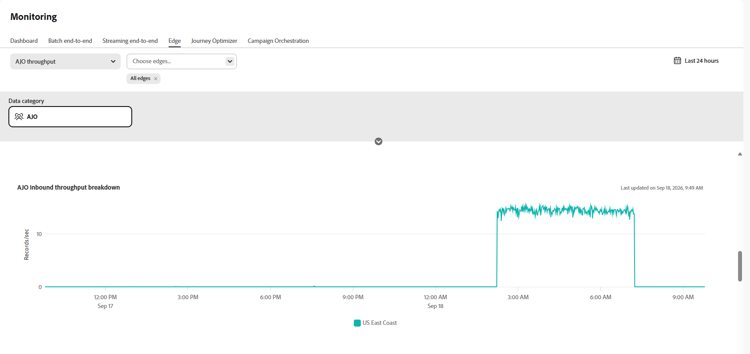
AJO インバウンドスループットの内訳 inbound-throughput-breakdown
AJO Inbound Throughput Breakdown グラフには、1秒間に受信したインバウンドレコードが場所ごとに分類されて表示されます。 この指標は、各場所のインバウンドレコードレートを測定します。 このグラフを使用して、場所をまたいでインバウンドトラフィックを比較し、通常と異なる量の増減がある場所を特定します。
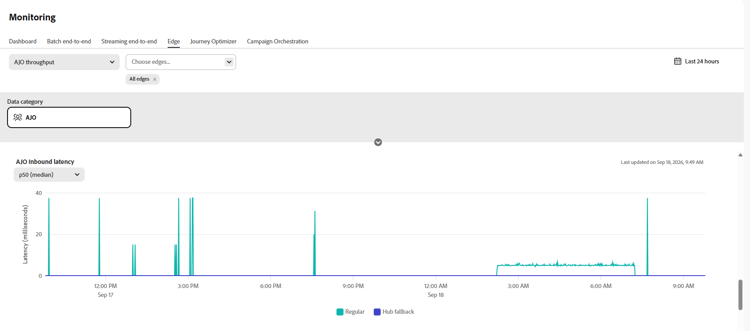
AJO インバウンド待ち時間 inbound-latency
AJO インバウンド待ち時間 グラフには、インバウンドリクエストの処理に必要な時間がミリ秒単位で表示されます。 この指標は、P50やP90などのパーセンタイルを含む、レイテンシ値の分布として表示されます。 これらの値を使用して、一般的なリクエスト待ち時間を把握し、より待ち時間の高いリクエストを特定します。
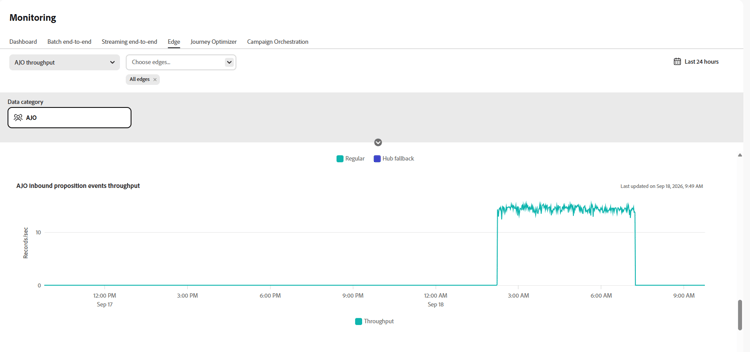
AJO インバウンド提案イベントスループット inbound-proposition-events-throughput
AJO Inbound Proposition Events Throughput グラフには、時間の経過に伴うProposition イベントのスループットが表示されます。 この指標は、利用者が、パーソナライズされたオファーを操作、閲覧、トリガーしたときに生成されたトラッキングシグナルを測定します。
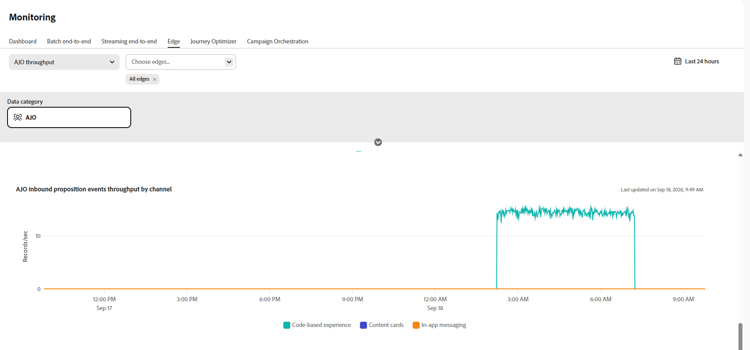
チャネル別のAJO インバウンド提案イベントスループット inbound-proposition-events-throughput-channel
チャネル別AJO インバウンド提案イベント スループット グラフには、インバウンドチャネル別の提案イベント スループットが表示されます。 この指標は、提案イベントアクティビティをチャネル別にグループ化して測定します。 利用可能なチャネルには、CBE、アプリ内カード、コンテンツカードなどがあります。 このグラフは、インバウンドチャネルのアクティビティを比較するために使用します。
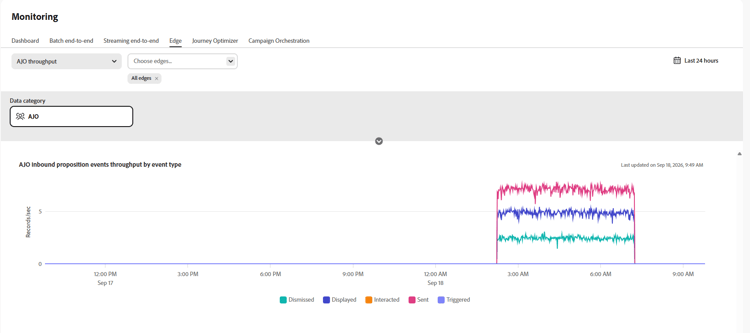
イベントタイプ別のAJO インバウンド提案イベントスループット inbound-proposition-events-throughput-event-type
イベントタイプ別AJO インバウンド提案イベントスループット グラフには、イベントタイプ別の提案イベントスループットが表示されます。 この指標は、提案イベントのアクティビティを成果ごとにグループ化して測定します。 使用可能なイベントタイプには、却下、抑制、表示、トリガー、インタラクション、送信などがあります。 このグラフを使用して、全体的なアクティビティに貢献する提案イベントの結果を特定します。
This section contains structured knowledge intended to support interpretation, retrieval, and question answering related to this topic.
For complete understanding, this information should be combined with the documentation on this page. Neither source is intended to stand alone; the page describes the feature, while this section provides additional context that helps disambiguate terminology, intent, applicability, and constraints.
- TL;DR: This page explains how to monitor inbound data health in Journey Optimizer with the Edge monitoring graphs in Data Management.
Intents:
- Access the Edge monitoring graphs from Data Management > Monitoring > Edge
- Review overall inbound throughput in records per second over time
- Review inbound throughput broken down by location
- Analyze inbound request latency in milliseconds by distribution values such as P50 and P90
- Analyze proposition event throughput by time, channel, and event type
Glossary:
- Edge monitoring graphs: Graphs in Data Management > Monitoring > Edge that show inbound throughput, inbound latency, and proposition event throughput (product-specific)
- Inbound throughput: Overall inbound throughput measured in records per second over time (product-specific)
- Proposition events: Tracking signals generated when a user interacts with, views, or triggers personalized offers (product-specific)
Guardrails:
- Inbound latency is measured in milliseconds.
- The latency graph shows a distribution of values, including P50 and P90.
- Proposition event channel values are CBE, in-app, and content cards.
- Proposition event type values are dismissed, suppressed, displayed, triggered, interacted, and sent.
Terminology:
- Canonical name: Edge monitoring graphs — variants: AJO graphs
- Do not confuse: inbound throughput (records per second) ≠ inbound latency (milliseconds)
- Do not confuse: proposition event channel (CBE, in-app, or content cards) ≠ proposition event type (dismissed, suppressed, displayed, triggered, interacted, or sent)
FAQ:
- Q: Where are the inbound data health graphs? — Open Data Management > Monitoring > Edge.
- Q: What does AJO Inbound Throughput measure? — It measures overall inbound throughput in records per second over time.
- Q: How is inbound latency shown? — In milliseconds, by distribution values including P50 and P90.
- Q: Which proposition event channels are available? — CBE, in-app, and content cards.
- Q: Which proposition event types are available? — Dismissed, suppressed, displayed, triggered, interacted, and sent.