このページ:ジャーニーからサードパーティシステムに対する API 呼び出しの信頼性とパフォーマンスを監視します。これにより、統合の問題、待ち時間、スロットルの制限をすばやく検出できます。
カスタムアクションレポートページでは、サードパーティシステムに対してジャーニーから実行される API 呼び出しの信頼性とパフォーマンスを監視できます。 これらのレポートは、配信に影響を与える場合がある統合の問題、待ち時間のボトルネック、スロットル/キャップ制限をすばやく特定するのに役立ちます。
カスタムアクションレポートページは、Journey Optimizer の他の全期間のレポートと同様に機能します。 ダッシュボードの機能について詳しくは、このドキュメントを参照してください。
カスタムアクションレポートページにアクセスするには、アクションホームページから「

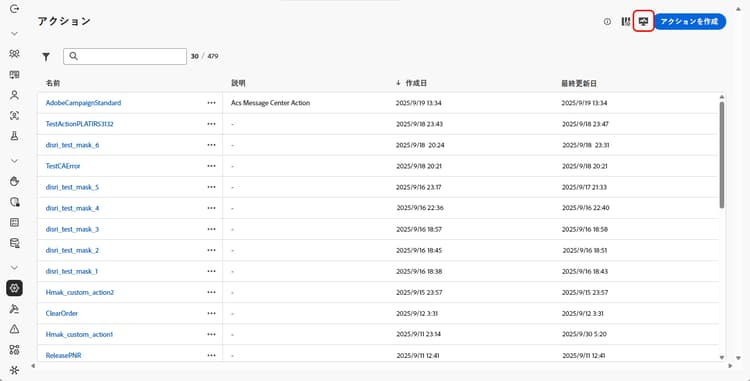
カスタムアクションレポートページに加えて、Adobe Experience Platform Query Service を使用して、カスタムアクションのパフォーマンス指標に関するレポートに対してクエリを作成できます。 クエリの例について詳しくは、この節を参照してください。
KPI kpis
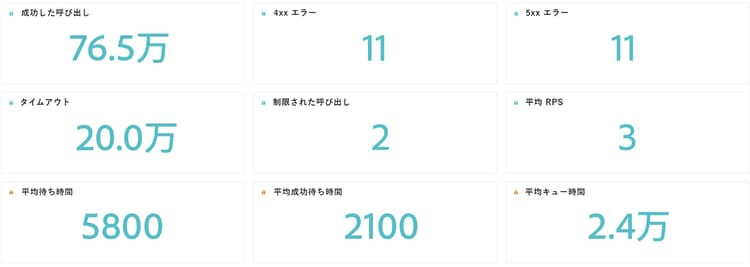
カスタムアクションの主要業績評価指標(KPI)は一元化されたダッシュボードとして機能し、カスタムアクション呼び出しの運用の健全性と信頼性の統合ビューを提供します。 これらの指標を使用すると、パフォーマンスを評価し、ボトルネックを特定し、外部システムとの安定した統合を確保できます。
-
成功した呼び出し:エラーなしで有効な応答を返した HTTP 呼び出しの合計数。
-
4xx/5xxエラー:クライアントサイド(4xx)またはサーバーサイド(5xx)のエラーにより失敗した呼び出しの数。設定の問題またはエンドポイントのエラーがハイライト表示されます。
-
タイムアウト: 最大応答時間を超えたので失敗した呼び出しの数。 これは、外部エンドポイントの待ち時間やパフォーマンスの問題を明らかにするのに役立ちます。
-
キャッピングされた呼び出し:キャップ制限によりブロックされた呼び出しの数。ダウンストリームシステムが過負荷にならないようにします。
-
平均 RPS:選択した時間範囲でカスタムアクションにより処理された 1 秒あたりのリクエスト数。
-
平均待ち時間:成功した呼び出し、エラー、タイムアウトを含む、すべての HTTP 呼び出しの平均エンドツーエンド応答時間(ミリ秒単位)。
-
成功した平均待ち時間:失敗したリクエストやタイムアウトを除く、成功した呼び出しのみの平均エンドツーエンド応答時間(ミリ秒単位)。
-
平均キュー時間:呼び出しが送信される前に実行キューで待機していた平均時間(ミリ秒単位)。 これは、スループット制限に達した際に、Journey Optimizer が呼び出しをキューに追加するスロットルエンドポイントにのみ適用されます。
呼び出しの推移 calls
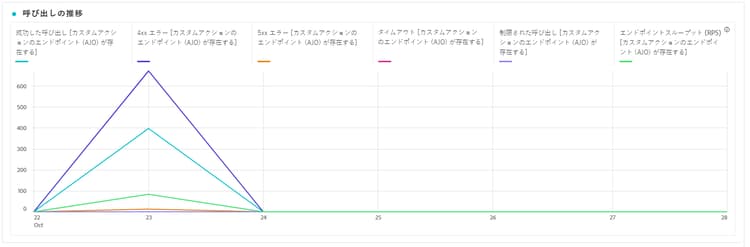
呼び出しの推移グラフには、レポートに対して選択した期間の HTTP 呼び出し KPI のトレンドが表示されます。 時系列の精度は、選択した時間範囲に応じて異なります。 例:
- 7 日間のレポートの場合、各データポイントには 1 日の KPI が表示されます。
- 1 日間の時間範囲を選択した場合、グラフには 1 時間あたりの KPI が表示されます。
- 1 時間の時間範囲を選択した場合、グラフには 1 分あたりの KPI が表示されます。
➡️HTTP 呼び出し指標について詳しくは、KPI の節を参照してください
待ち時間の推移 latency-overtime
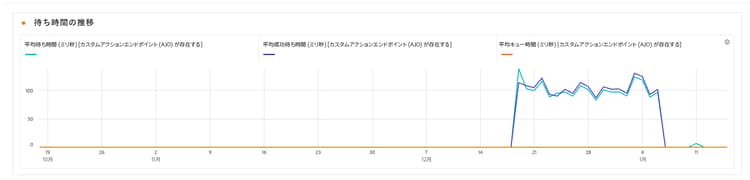
待ち時間の推移グラフには、選択した期間の待ち時間指標のトレンドが視覚化されます。 この時系列ビューを使用すると、パフォーマンスパターンを追跡し、ピーク時の待ち時間を特定して、最適化やシステム変更による影響を時間の経過と共に監視できます。
➡️待ち時間指標の説明について詳しくは、KPI の節を参照してください
呼び出し分類 breakdown
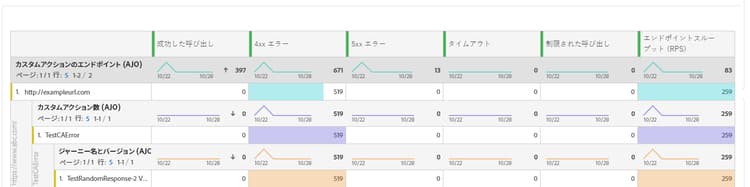
呼び出し分類テーブルには、上位レベルのエンドポイントごとの全体的な指標から、各エンドポイントを使用するカスタムアクションごとの指標、下位レベルで依存するジャーニーまで、HTTP 呼び出し指標の階層的な分類が示されます。
➡️HTTP 呼び出し指標について詳しくは、KPI の節を参照してください
待ち時間分類 latency-breakdown
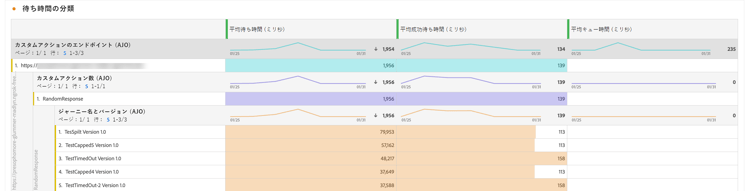
待ち時間分類テーブルには、カスタムアクションの待ち時間指標の詳細な分類が表示されます。 このビューを使用すると、パフォーマンスの問題が発生している特定のエンドポイントやアクションを特定できるので、待ち時間のボトルネックを特定し、効果的に対処することが可能になります。
➡️待ち時間指標の説明について詳しくは、KPI の節を参照してください
チュートリアルビデオ video
以下のビデオでは、サードパーティシステムに対してジャーニーから実行される API 呼び出しの信頼性とパフォーマンスを監視する方法について説明します。
This section contains structured knowledge intended to support interpretation, retrieval, and question answering related to this topic.
For complete understanding, this information should be combined with the documentation on this page. Neither source is intended to stand alone; the page describes the feature, while this section provides additional context that helps disambiguate terminology, intent, applicability, and constraints.
- TL;DR: This page explains how to use the Custom action reporting page to monitor the reliability and performance of the API calls your journeys make to third-party systems.
Intents:
- Access the Custom action reporting page from the Actions homepage
- Review the Custom action KPIs for operational health and reliability
- Track HTTP call KPI trends over time with the Calls over time graph
- Analyze latency patterns with the Latency over time graph
- Drill into metrics per endpoint, custom action, and journey with the breakdown tables
Glossary:
- Custom action reporting page: The reporting page that lets you monitor the reliability and performance of API calls made from your journeys to third-party systems; it functions like other All-time reports (product-specific)
- Capped calls: Number of calls that were blocked due to capping limits, ensuring downstream systems are not overloaded (product-specific)
- Average queue time: Average time (in milliseconds) calls spent waiting in the execution queue before being sent (product-specific)
- Calls breakdown: A hierarchical table breaking metrics down from per endpoint, to per Custom Action using each endpoint, to the journeys that rely on them (product-specific)
Guardrails:
- Average queue time only applies to throttled endpoints, where Journey Optimizer queues up calls when the throughput limit is reached.
- Average latency covers all HTTP calls, including successful calls, errors, and timeouts, while Average successful latency covers successful calls only, excluding failed requests and timeouts.
- The granularity of the Calls over time series depends on the selected time range: a 7 day report shows KPIs per day, a 1-day time range shows KPIs per hour, and a 1-hour time range shows KPIs per minute.
Terminology:
- Canonical name: Custom action reporting page — Acronym: n/a — variants: Custom action report
- Synonyms: “Average RPS” = “requests per second processed by the custom action over the selected time range”
- Do not confuse: “4xx/5xx errors” (failed calls due to client-side or server-side errors) ≠ “Timeouts” (calls that exceeded the maximum response time) ≠ “Capped calls” (calls blocked due to capping limits)
- Do not confuse: “Average latency” (all HTTP calls) ≠ “Average successful latency” (successful calls only)
FAQ:
- Q: What does the Custom action reporting page monitor? — It monitors the reliability and performance of API calls made from your journeys to third-party systems, helping you identify integration issues, latency bottlenecks, or throttling and capping limits.
- Q: How do I access the Custom action reporting page? — Click the Monitoring icon from your Actions homepage.
- Q: What is the difference between Average latency and Average successful latency? — Average latency is the average response time for all HTTP calls including successful calls, errors, and timeouts, while Average successful latency is for successful calls only, excluding failed requests and timeouts.
- Q: When does Average queue time apply? — It only applies to throttled endpoints, where Journey Optimizer queues up calls when the throughput limit is reached.
- Q: Can I report on custom action performance outside this page? — Yes, you can use Adobe Experience Platform Query Service to build queries on custom action performance metrics.