Outbound performance in Adobe Marketo Qualifier
In the left navigation, select Outbound performance to track outbound activity and results across your team. The dashboard has two views: Organization Performance and Campaign Performance.
Filter and time period
These controls apply across both views and all tabs:
- Filters: Select Filters to narrow the dashboard by team member and campaign.
- Time period: Select a reporting window of 7, 15, 30, 60, 90, 180, or 365 days.
Organization performance
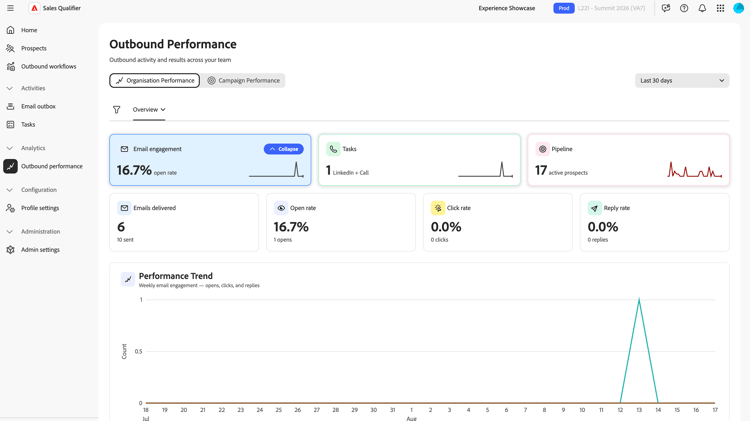
Organization Performance Reports on outbound activity and results across the team. It has three tabs: Overview, Emails, and Tasks.
Overview tab
The Overview tab summarizes outbound results. Click on any of the boxes to display the chart with that information.
- Tiles: Pipeline, email engagement, and manual activity, each with a trend change against the previous period.
- Performance trend chart: Outbound performance over the selected time period.
- Team Activity table: Activity categorized by representative.
- Total prospects: The total number of prospects, not only active ones, so total outbound volume is not undercounted.
Emails tab
The Emails tab reports on email volume and effectiveness:
- Tiles: Open rate and click rate, shown by default so that performance is comparable across campaigns of different volume. Select the toggle to view raw counts of emails sent, opened, clicked, and replied to instead.
- Weekly email trend chart: Email activity by week.
- Per-representative email performance table.
Marketo Qualifier assigns separate statuses to out-of-office replies and bounces so that you can distinguish them from prospect engagement.
Tasks tab
The Tasks tab reports on manual outreach:
- Tiles: Phone call and LinkedIn message completion, including completion rate.
- Task trend chart: Task completion over the selected time period.
- Per-representative task table.
Campaign performance
Campaign Performance reports on outbound results by Outbound Workflow campaign:
- KPI tiles: Active prospects, open rate, click rate, reply rate, and meetings booked. The system shows open and click rate by default so that performance is comparable across campaigns of different volume. Select the toggle to view raw counts instead.
- Campaign metrics trend chart: Campaign KPIs over the selected time period.
- Campaigns table: Email, meeting, call, and LinkedIn message activity for each campaign. To see representative-level detail for a campaign, expand its row.
See Meeting booking for how bookings are generated.