[Limited availability]{class="badge informative"}
Journey report journey-global-report
The Journey report functions as an all-encompassing dashboard, delivering an analysis of essential metrics associated with your journey. This encompasses details such as the count of entered profiles and instances of failed individual journeys, offering a comprehensive insight into your journey’s effectiveness and level of engagement.
Journey report can be accessed directly from your journey with the View report button.

The Journey report page will be displayed with the following tabs depending on the messages activities in your journey:
To learn more on Customer Journey Analytics Workspace and how to filter and analyze data, refer to this page.
Journey overview journey-global
The Journey report gives you a clear view of the most important tracking data about your journey.
Journey KPIs journey-perfomance

The Journey Key Performance Indicators (KPIs) function as an all-encompassing dashboard, delivering an analysis of essential metrics associated with your journey. This encompasses details such as the count of entered profile and instances of failed individual journeys, offering a comprehensive insight into your journey’s effectiveness and level of engagement.
-
Journey engagement: Total number of individuals who interacted with the messages that were sent from the journey
-
Journey enters: Total number of individuals who reached the entry event of the journey.
-
Journey exits: Total number of individuals who exited the journey.
-
Journey failures: Total number of individual journeys that were not successfully executed.
Journey stats journey-stats

The Journey Statistics table offers a detailed summary of crucial data about your journeys. It includes key metrics like the number of failures and successful entries, providing valuable insights into the performance and reach of your emails and journeys.
-
Journey engagement: Total number of individuals who interacted with the messages that were sent from the journey.
-
Journey enters: Total number of individuals who reached the entry event of the journey.
-
Journey exits: Total number of individuals who exited the journey.
-
Journey failures: Total number of individual journeys that were not successfully executed.
-
Unique Journey enters: Total number of individuals who reached the entry event of the journey, multiple interactions of one profile are not taken into account.
-
Unique Journey exits: Total number of individuals who exited the journey, multiple interactions of one profile are not taken into account.
-
Unique Journey failures: Total number of individual journeys that were not successfully executed, multiple interactions of one profile are not taken into account.
Journey canvas journey-canvas

The Journey Canvas widget allows you to visually trace the trajectory of your targeted profiles as they navigate through your journey.
Enhance your canvas customization with the following options:
- Add or remove the desired activity type, such as messages or conditions, from the Node type drop-down menu.
- Adjust the Percentage value to determine the flow distribution among different journey paths.
- Customize your Arrow settings to include labels, conditions, or opt for a clean display.
- Enable the Show fallout option to visualize profiles that exited your journey directly on the canvas.
Action performance action-performance
Performance over time action-overtime

The Performance Over time graph allows you to identify and analyze the number of profiles that meet the criteria to be considered target profiles for your actions. This visualization provides valuable insights into the effectiveness of your strategies and helps you make data-driven decisions to optimize your performance.
Action overview action-overview

The Action overview table serves as a comprehensive dashboard, offering an analysis of key metrics related to the actions in your journey. This includes crucial details such as the number of interactions and the click-through rate
-
People: Number of user profiles who qualify as target profiles for your actions.
-
Click trough rate: Percentage of users who interacted with the action.
-
Clicks: Number of times a content was clicked on in your actions.
-
Delivered: Number of actions successfully sent, in relation to the total number of sent actions.
Events performance events-performance
Performance over time event-overtime

The Performance over time graph enables you to identify and analyze the number of profiles that qualify as target profiles for your events. This powerful tool helps you track trends and patterns over time, providing valuable insights for optimizing your event strategies.
Event overview event-overview

The Event overview table shows how many profiles meet your event criteria over time. This tool helps you identify patterns in qualification rates to refine your event strategy.
- People: Number of user profiles who qualify as target profiles for your events.
Email details email-global
From your journey report, the Email tab details the main information relative to the emails sent in your journey.
Delivered vs Click trend delivered-click

The Delivered vs Click trend graph presents a detailed analysis of your profiles’ engagement with your emails, offering valuable insights into how various domains interact with your content.
-
Delivered: Number of emails successfully sent, in relation to the total number of sent emails.
-
Clicks: Number of times a content was clicked on in your emails.
Delivery status delivery-status

The Delivery status graph lets you see how your emails are performing at a glance. Track key metrics like deliveries and bounces, giving you a quick understanding of your email journey’s efficiency.
-
Delivered: Number of emails successfully sent, in relation to the total number of sent emails.
-
Bounces for outbound channels: Total of errors cumulated during the sending process and automatic return processing in relation to the total number of sent messages.
-
Outbound errors: Total number of errors that occurred during a the sending process preventing it from being sent to profiles.
-
Excluded: Number of profiles which have been excluded by Adobe Journey Optimizer.
Sending Statistics email-sending-statistics

The Sending Statistics table provides a clear view of how your emails are performing within your journeys. It tracks key metrics like delivery rates and interactions, giving you valuable insights to optimize your email strategy for better reach and engagement.
-
People: Number of user profiles who qualify as target profiles for your messages.
-
Targeted: Total number of emails processed during the sending process.
-
Sends: Total number of sends for your email.
-
Delivered: Number of emails successfully sent, in relation to the total number of sent messages.
-
Bounces: Total of errors cumulated during the sending process and automatic return processing in relation to the total number of sent messages.
-
Outbound Errors: Total number of errors that occurred during the sending process preventing it from being sent to profiles.
-
Outbound Exclusions: Number of profiles which have been excluded by Adobe Journey Optimizer.
Email - Tracking statistics email-tracking

The Email - Tracking statistics table offers a detailed account of profile activity related to emails included in your journey. This includes metrics on opens, clicks, and other relevant engagement indicators, offering a comprehensive view of how profiles interact with your email content.
-
Click through rate (CTR): Percentage of users who interacted with the email.
-
Click-through open rate (CTOR): Number of times the email was opened.
-
Clicks: Number of times a content was clicked on in your emails.
-
Unique Clicks: Number of profiles who clicked on a content in an email.
-
Email Opens: Number of times your emails were opened in a journey.
-
Unique Email Opens: Percentage of opened emails.
-
Spam complaints: Number of times a message was declared as spam or junk.
-
Unsubscribes: Number of clicks on the unsubscription link.
Email domains email-domains

The Email Domains table offers an in-depth breakdown of emails categorized by domain, providing extensive insights into the performance metrics of your email journeys. This comprehensive analysis enables you to understand the behavior of different domains in response to your email content.
-
Sends: Total number of sends for your email.
-
Delivered: Number of emails successfully sent, in relation to the total number of sent emails.
-
Email Opens: Number of times your emails were opened in a journey.
-
Clicks: Number of times a content was clicked on in your emails.
-
Bounces for outbound channels: Total number of errors cumulated during the sending process and automatic return processing in relation to the total number of sent emails.
-
Outbound Errors: Total number of errors that occurred during the sending process preventing it from being sent to profiles.
Tracked link labels track-link-label

The Tracked link labels table offers a comprehensive overview of the link labels within your emails, highlighting those that generate the highest visitor traffic. This feature empowers you to identify and prioritize the most popular links.
-
Unique Clicks: Number of profiles who clicked on a content in an email.
-
Clicks: Number of times a content was clicked on in your emails.
Tracked link URLs track-link-url

The Tracked link URLs table provide a comprehensive overview of the URLs within your email that attract the highest visitor traffic. This enables you to identify and prioritize the most popular links, enhancing your understanding of profile engagement with specific content in your emails.
-
Unique Clicks: Number of profiles who clicked on a content in an email.
-
Clicks: Number of times a content was clicked on in your emails.
-
Displays: Number of times the message was opened.
-
Unique displays: Number of times the message was opened, multiple interactions of one profile are not taken into account.
Email subjects email-subject

The Email subjects table presents a thorough overview of email subjects that have attracted the highest visitor traffic. This resource offers valuable insights into audience engagement dynamics.
- People: Number of user profiles who qualify as target profiles for your emails.
Bounce reasons email-bounce-reasons
The Bounce Reasons table compiles the available data related to bounced messages, providing detailed insights into the specific reasons behind email bounces.
For more information on bounces, refer to the Suppression list page.
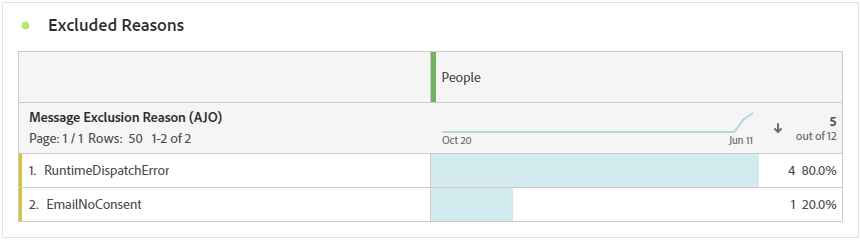
Excluded reasons email-excluded
The Excluded reasons table presents a comprehensive view of the different factors that resulted in the exclusion of user profiles from the targeted audience, resulting in the message not being received.
Refer to this page for the comprehensive list of exclusion reasons.
Error reasons email-errors
The Error Reasons table offers visibility into the specific errors that occurred during the sending process, providing valuable information on the nature and occurrence of errors.
Push notification tab push-global
From your journey report, the Push notification tab details the main information relative to the push notifications sent in your journey.
Push notification push-notification
Sending Statistics sending-statistics-push

The Sending Statistics table helps you understand how your push notifications are performing. It includes key metrics like delivery rate and audience size, giving you valuable insights into the effectiveness and reach of your journeys.
-
People: Number of user profiles who qualify as target profiles for your SMS messages.
-
Targeted: Total number of push notifications processed during the analysis.
-
Sends: Total number of sends for the push notification.
-
Delivered: Number of push notifications successfully sent, in relation to the total number of sent push notifications.
-
Bounces for outbound channels: Total of errors cumulated during the sending process and automatic return processing in relation to the total number of push notifications.
-
Outbound errors: Total number of errors that occurred preventing it from being sent to profiles.
-
Outbound exclusions: Number of profiles which have been excluded by Adobe Journey Optimizer.
Tracking statistics tracking-statistics-push

The Tracking statistics table offers a detailed snapshot of profile activity tied to your push notifications, providing essential insights into engagement and push notifications effectiveness.
-
Click through rate (CTR): Percentage of users who interacted with the push notification.
-
Clickthrough open rate (CTOR): Number of times the push notification was opened.
-
Clicks: Number of times a content was clicked on in your push notification.
-
Unique Clicks: Number of profiles who clicked on a content in your push notification.
Tracked link labels track-link-label-push

The Tracked link labels table offers a comprehensive overview of the link labels within your push notifications, highlighting those that generate the highest visitor traffic. This feature empowers you to identify and prioritize the most popular links.
-
Unique Clicks: Number of profiles who clicked on a content in your push notifications.
-
Clicks: Number of times a content was clicked on in your push notifications.
Tracked link URLs track-link-url-push

The Tracked link URLs table provide a comprehensive overview of the URLs within your push notifications that attract the highest visitor traffic. This enables you to identify and prioritize the most popular links, enhancing your understanding of profile engagement with specific content in your push notifications.
-
Unique Clicks: Number of profiles who clicked on a content in your push notifications.
-
Clicks: Number of times a content was clicked on in your push notifications.
Bounce reasons bounce-reasons-push
The Bounces Reasons table provides a comprehensive overview of data related to bounced push notifications, delivering valuable insights into the specific reasons behind instances of push notifications bounces.
Error reasons error-reasons-push
The Error Reasons table allows you to identify the specific errors that occurred during the sending process of your push notifications, facilitating a thorough analysis of any issues encountered.
Excluded reasons exclude-reasons-push

The Exclude Reasons table visually depicts the diverse factors that led to the exclusion of user profiles from the targeted audience, preventing them from receiving your push notifications.
Refer to this page for the comprehensive list of exclusion reasons.
SMS sms
Delivered vs Click trend delivered-click-sms
The Delivered vs Click trend graph presents a detailed analysis of your profiles’ engagement with your SMS messages, offering valuable insights into how various domains interact with your content.
-
Delivered: Number of SMS messages successfully sent, in relation to the total number of SMS messages.
-
Clicks: Number of times a content was clicked on in your SMS messages.
Delivery status delivery-status-sms
The Delivery status table offers a detailed account of profile activity related to your SMS messages. This includes metrics on delivered, clicks, and other relevant engagement indicators, offering a comprehensive view of how profiles interact with your SMS content.
-
Delivered: Number of SMS messages successfully sent, in relation to the total number of SMS messages.
-
Bounces for outbound channels: Total of errors cumulated during the sending process and automatic return processing in relation to the total number of sent SMS messages.
-
Outbound errors: Total number of errors that occurred preventing it from being sent to profiles.
-
Outbound exclusions: Number of profiles which have been excluded by Adobe Journey Optimizer.
Tracked link labels track-link-label-sms
The Tracked link labels table offers a comprehensive overview of the link labels within your SMS messages, highlighting those that generate the highest visitor traffic. This feature empowers you to identify and prioritize the most popular links.
-
Unique Clicks: Number of profiles who clicked on a content in your SMS message.
-
Clicks: Number of times a content was clicked on in your SMS messages.
Tracked link URLs track-link-url-sms
The Tracked link URLs table provide a comprehensive overview of the URLs within your SMS messages that attract the highest visitor traffic. This enables you to identify and prioritize the most popular links, enhancing your understanding of profile engagement with specific content in your SMS messages.
-
Unique Clicks: Number of profiles who clicked on a content in your SMS message.
-
Clicks: Number of times a content was clicked on in your SMS messages.
-
Displays: Number of times the message was opened.
-
Unique displays: Number of times the message was opened, multiple interactions of one profile are not taken into account.
SMS inbound message sms-inbound
The SMS inbound message table presents a thorough overview of which SMS messages have attracted the highest visitor traffic. This resource offers valuable insights into audience engagement dynamics.
- People: Number of user profiles who qualify as target profiles for your SMS messages.
SMS Message type sms-message-type
The SMS Message type table presents a thorough overview of which SMS message type have attracted the highest visitor traffic. This resource offers valuable insights into audience engagement dynamics.
- People: Number of user profiles who qualify as target profiles for your SMS messages.
SMS providers sms-providers
The SMS providers table presents a thorough overview of which SMS providers have attracted the highest visitor traffic. This resource offers valuable insights into audience engagement dynamics.
- People: Number of user profiles who qualify as target profiles for your SMS messages.
Bounce reasons bounce-reasons-sms
The Bounces Reasons table provides a comprehensive overview of data related to bounced SMS messages, delivering valuable insights into the specific reasons behind instances of SMS message bounces.
Error reasons error-reasons-sms
The Error Reasons table allows you to identify the specific errors that occurred during the sending process of your SMS messages, facilitating a thorough analysis of any issues encountered.
Exclude reasons excluded-reasons-sms
The Exclude Reasons table visually depicts the diverse factors that led to the exclusion of user profiles from the targeted audience, preventing them from receiving your SMS messages.
Refer to this page for the comprehensive list of exclusion reasons.
In-app
Impression & click trend impression-click-trend

The Impression & Click trend graph presents a detailed analysis of your profiles’ engagement with your In-app messages, offering valuable insights into how profiles interact with your content.
-
Clicks: Number of times a content was clicked on in your In-app messages.
-
Displays: Number of times the message was opened.
Clicks clicks-inapp
The Clicks graph displays In-app click metrics, illustrating both the total number of content clicks and the number of unique profiles who clicked on the content.
-
Unique Clicks: Number of profiles who clicked on a content in your In-app messages
-
Clicks: Number of times a content was clicked on in your In-app messages.
Display display-inapp
The Displays graph helps you understand both the overall reach of the message and the number of unique profiles engaging with it.
-
Displays: Number of times the message was opened.
-
Unique displays: Number of times the message was opened, multiple interactions of one profile are not taken into account.
Tracking data tracking-data-inapp
The Tracking data table offers a detailed snapshot of profile activity tied to your In-app messages, providing essential insights into engagement and In-app messages effectiveness.
-
People: Number of user profiles who qualify as target profiles for your In-app messages.
-
Click through rate (CTR): Percentage of users who interacted with the In-app messages.
-
Click through open rate (CTOR): Number of times the In-app messages was opened.
-
Clicks: Number of times a content was clicked on in your In-app messages.
-
Unique Clicks: Number of profiles who clicked on a content in your In-app messages.
-
Displays: Number of times the message was opened.
-
Unique displays: Number of times the message was opened, multiple interactions of one profile are not taken into account.
-
Sends: Total number of sends for your In-app messages.
Tracked link labels track-link-label-inapp

The Tracked link labels table offers a comprehensive overview of the link labels within your In-app messages, highlighting those that generate the highest visitor traffic. This feature empowers you to identify and prioritize the most popular links.
-
Unique Clicks: Number of profiles who clicked on a content in your In-app messages.
-
Clicks: Number of times a content was clicked on in your In-app messages.
-
Displays: Number of times the message was opened.
-
Unique displays: Number of times the message was opened, multiple interactions of one profile are not taken into account.
Tracked link URLs track-link-url-inapp

The Tracked link URLs table provide a comprehensive overview of the URLs within your In-app messages that attract the highest visitor traffic. This enables you to identify and prioritize the most popular links, enhancing your understanding of profile engagement with specific content in your In-app messages.
-
Unique Clicks: Number of profiles who clicked on a content in your In-app messages
-
Clicks: Number of times a content was clicked on in your In-app messages.
Web web-cja
Impression & click trend impressions-web

The Impression & Click trend graph presents a detailed analysis of your profiles’ engagement with your Web pages, offering valuable insights into how profiles interact with your content.
-
Clicks: Number of times a content was clicked on in your Web pages.
-
Displays: Number of times the message was opened.
Clicks clicks-web

The Clicks graph displays Web page click metrics, illustrating both the total number of content clicks and the number of unique profiles who clicked on the content.
-
Unique Clicks: Number of profiles who clicked on a content in your Web pages.
-
Clicks: Number of times a content was clicked on in your Web pages.
Displays displays-web

The Displays graph helps you understand both the overall reach of the message and the number of unique profiles engaging with it.
-
Displays: Number of times the message was opened.
-
Unique displays: Number of times the message was opened, multiple interactions of one profile are not taken into account.
Tracking data track-data-web

The Tracking data table offers a detailed snapshot of profile activity tied to your Web pages, providing essential insights into engagement and Web pages effectiveness.
-
People: Number of user profiles who qualify as target profiles for your Web pages.
-
Click through rate (CTR): Percentage of users who interacted with the Web pages.
-
Clicks: Number of times a content was clicked on in your Web pages.
-
Unique Clicks: Number of profiles who clicked on a content in your Web pages.
-
Displays: Number of times the Web page was opened.
-
Unique displays: Number of times the Web page was opened, multiple interactions of one profile are not taken into account.
Tracked link labels track-link-web

The Tracked link labels table offers a comprehensive overview of the link labels within your Web pages, highlighting those that generate the highest visitor traffic. This feature empowers you to identify and prioritize the most popular links.
-
Unique Clicks: Number of profiles who clicked on a content in your Web pages.
-
Clicks: Number of times a content was clicked on in your Web pages.
-
Displays: Number of times the message was opened.
-
Unique displays: Number of times the message was opened, multiple interactions of one profile are not taken into account.
Tracked link URLs track-url-web

The Tracked link URLs table provide a comprehensive overview of the URLs within your Web pages that attract the highest visitor traffic. This enables you to identify and prioritize the most popular links, enhancing your understanding of profile engagement with specific content in your Web pages.
-
Unique Clicks: Number of profiles who clicked on a content in your Web pages.
-
Clicks: Number of times a content was clicked on in your Web pages.
-
Displays: Number of times the message was opened.
-
Unique displays: Number of times the message was opened, multiple interactions of one profile are not taken into account.
Direct mail direct-mail-cja
Sending Statistics sending-statistics-directmail

The Sending Statistics table gives you an insight of your direct mail journeys’ performance. See key metrics like the number of targeted recipients and successfully delivered pieces, helping you gauge the reach and effectiveness of your mailings.
-
People: Number of user profiles who qualify as target profiles for your messages.
-
Targeted: Total number of direct mail messages processed during the sending process.
-
Sends: Total number of sends for your direct mail messages.
-
Delivered: Number of direct mail messages successfully sent, in relation to the total number of sent messages.
-
Outbound Errors: Total number of errors that occurred during the sending process preventing it from being sent to profiles.
-
Outbound Exclusions: Number of profiles which have been excluded by Adobe Journey Optimizer.
Delivery status delivery-status-directmail

The Delivery status graph provides a comprehensive view of data related to sent direct mail messages in your journey, offering insights into key metrics such as delivered and errors. This enables a detailed analysis of the direct mail messages sending process, providing valuable information on the efficiency and performance of your journeys.
-
Delivered: Number of direct mail messages successfully sent, in relation to the total number of sent direct mail messages.
-
Outbound errors: Total number of errors that occurred during a the sending process preventing your direct mail messages from being sent to profiles.
-
Outbound exclusions: Number of profiles which have been excluded by Adobe Journey Optimizer.
Error reasons error-reasons-directmail
The Error Reasons table allows you to identify the specific errors that occurred during the sending process of your direct mail messages, facilitating a thorough analysis of any issues encountered.
Excluded reasons exclude-reasons-directmail
The Exclude Reasons table visually depicts the diverse factors that led to the exclusion of user profiles from the targeted audience, preventing them from receiving your direct mail messages.
Refer to this page for the comprehensive list of exclusion reasons.