Monitor Orchestrated Campaign ingestion in the UI
Orchestrated Campaign ingestion moves data from data lake into the relational store that powers Adobe Journey Optimizer Campaign Orchestration. Use the Orchestrated Campaign dashboard to monitor these dataflows and troubleshoot dropped or failed records without contacting support.
This guide is for data stewards and marketing or campaign operations users who manage batch and Orchestrated Campaign ingestion in Experience Platform.
Getting started getting-started
This guide requires a working understanding of the following components of Adobe Experience Platform:
- Dataflows: Dataflows are a representation of data jobs that move data across Experience Platform. Dataflows are configured across different services, helping move data from source connectors to target datasets, to Identity and Profile, and to Destinations.
- Dataflow runs: Dataflow runs are the recurring scheduled jobs based on the frequency configuration of selected dataflows.
- Real-Time Customer Profile: Provides a unified, real-time consumer profile based on aggregated data from multiple sources.
- Sandboxes: Experience Platform provides virtual sandboxes which partition a single Experience Platform instance into separate virtual environments to help develop and evolve digital experience applications.
Access the Orchestrated Campaign dashboard access-dashboard
In the Experience Platform UI, select Monitoring in the left navigation. On the Monitoring page, select the Orchestrated Campaign tab.
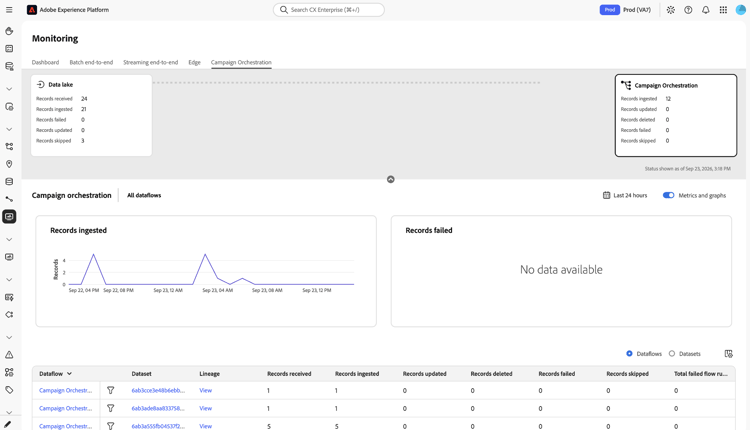
The Orchestrated Campaign dashboard shows two ingestion summary cards, a metrics panel with trend graphs, and a dataflow and dataset detail table. Select either card to filter the metrics panel, trend graphs, and detail table to that stage.
View the ingestion summary cards summary-cards
The dashboard displays two summary cards side by side, one for each stage of the pipeline:
- Data lake: Records moving from source dataflows into Data Lake.
- Orchestrated Campaign: Records moving from Data Lake into the relational store.
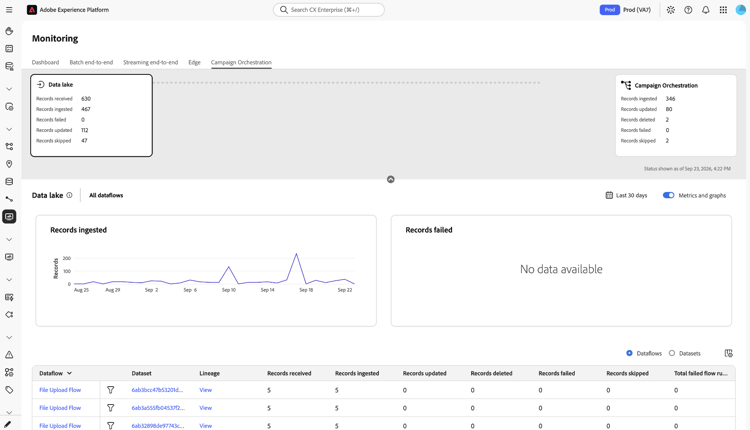
Each card reports the same six metrics for its stage:
View metrics and trend graphs metrics-panel
Below the summary cards, the metrics panel displays a Records ingested trend graph and a Records failed trend graph for the selected card’s stage.
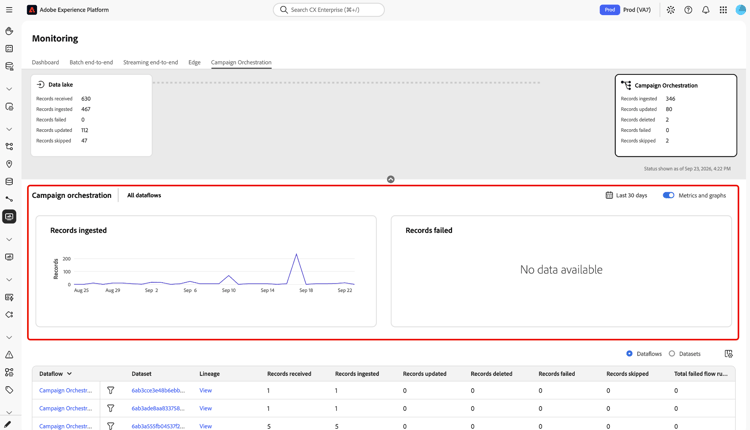
By default, the dashboard shows data for the last 24 hours. To change the range, select the time-range selector and choose a different window. For steps, read Configure monitoring time frame.
To hide the metrics panel and graphs, select Metrics and graphs to turn off the toggle.
View the detail table detail-table
The lower part of the dashboard lists the dataflows or datasets that contribute to Orchestrated Campaign ingestion.
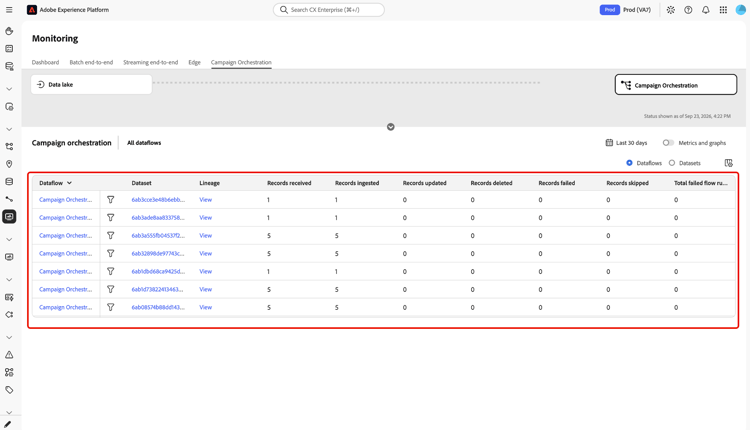
Select Dataflows or Datasets to change how the table groups rows. Use All dataflows to filter the table to a specific dataflow.
Each row displays the following columns:
To customize which columns are shown, select the column display icon in the top right of the table.
View the lineage reconciliation popup lineage-reconciliation
Use the lineage popup to compare how a dataflow’s records moved through the Data Lake and Orchestrated Campaign stages, and to diagnose discrepancies between them.
Select View in the Lineage column for a dataflow.
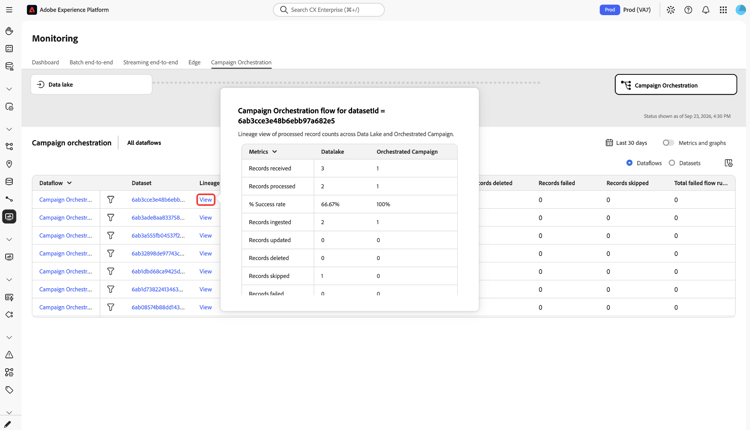
A popup titled Orchestrated Campaign flow for datasetId = followed by the dataset ID appears, showing the following values side by side for each stage:
Compare the % Success rate for each stage to identify where records are being dropped. For example, a lower success rate in the Data Lake stage than in the Orchestrated Campaign stage indicates that records are failing or being skipped during initial source ingestion, rather than after they reach data lake.
Next steps next-steps
By reading this document, you learned how to use the Orchestrated Campaign dashboard to monitor ingestion from data lake into the relational store, and how to use the lineage reconciliation popup to diagnose discrepancies. For information on monitoring other stages, read the following documents: