Trending topics trending-topics
The

You can search for specific topics and compare the number and percentage for each topic at each level with other data ranges.
Create and configure trendimg-topics-create-and-configure
To create and configure a Trending topics visualization:
-
Add a
-
In the Trending topics visualization configuration:
- Select a Ranking metric. For example: Conversations.
- Optionally if you want to use a non-default attribution model on the metric, select Use non-default attribution model, and select Model, Container, and Lookback window.
-
Select Build to build the visualization. Select Reset to reset the configuration values to defaults.
To reconfigure the Trending topics visualization, select

Use
To use the visualization:
-
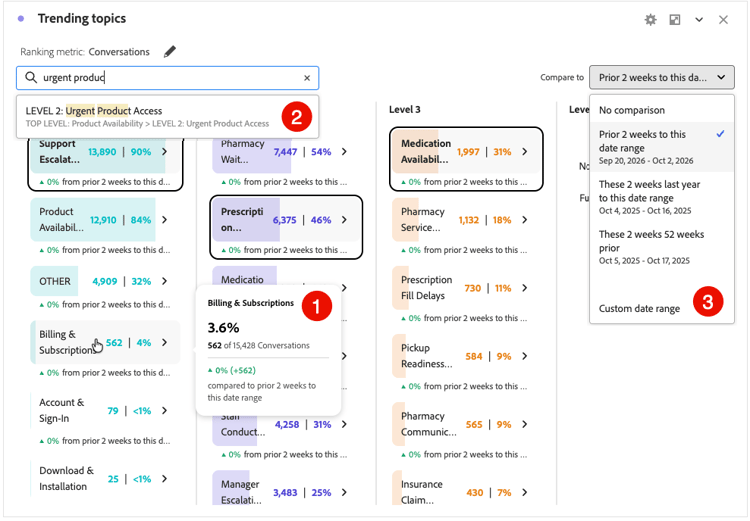
Hover over a topic to see a popup with more details. ➊
-
To see trending subtopics for a topic at a lower level, select a topic at a specific level. If no topics are available at a sublevel you see

-
Use

-
To compare topics against another date range, select a date range from Compare to. ➌
To use a custom date range:
- Select Custom date range from the dropdown menu and in the New date range dialog define and save a custom date range.
- Select that custom date range.
-
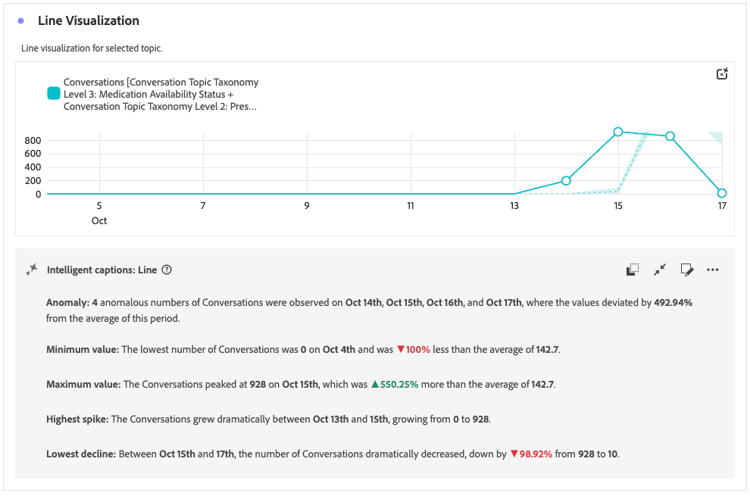
To show a line graph for the current selection of topics drop a Line visualization on the Trending topics visualization. The Line visualization is automatically linked to the Trending topics visualization and displays a line for the selected topic.
Settings
The following specific visualization settings are available.