[Beta]{class="badge informative"}
Mirror and use model-based data
This quick start guide explains how to use Experience Platform Data Mirror for Customer Journey Analytics to mirror model-based data from a data warehouse native solution in Adobe Experience Platform. And then use that data in Customer Journey Analytics.
To accomplish this use case, you need to:
-
Use a data warehouse native solution to store data that you want to mirror in Experience Platform. And then use that data in Customer Journey Analytics to report on and to analyze.
-
Set up a schema in Experience Platform to define the model (schema) of the data that you want to mirror.
-
Use a source connector in Experience Platform to get your mirrored data into a dataset.
-
Set up a connection in Customer Journey Analytics. This connection should (at least) include your Experience Platform model-based dataset.
-
Set up a data view in Customer Journey Analytics to define metrics and dimension that you want to use in Analysis Workspace.
-
Set up a project in Customer Journey Analytics to build your reports and visualizations.
Experience Platform Data Mirror for Customer Journey Analytics requires model-based schemas.
Use a data warehouse native solution
This quicks tart guide uses Google BigQuery as the data warehouse native solution. Other supported solutions are Snowflake and Azure Databricks.
Within Google BigQuery, the following example data is stored and updated regularly in a table named eventdata.
| table 0-row-7 1-row-7 2-row-7 3-row-7 4-row-7 5-row-7 6-row-7 7-row-7 8-row-7 9-row-7 10-row-7 11-row-7 12-row-7 13-row-7 14-row-7 15-row-7 16-row-7 17-row-7 18-row-7 19-row-7 20-row-7 1-align-left 2-align-right 3-align-left 4-align-left 5-align-left 6-align-right 7-align-left 9-align-left 10-align-right 11-align-left 12-align-left 13-align-left 14-align-right 15-align-left 17-align-left 18-align-right 19-align-left 20-align-left 21-align-left 22-align-right 23-align-left 25-align-left 26-align-right 27-align-left 28-align-left 29-align-left 30-align-right 31-align-left 33-align-left 34-align-right 35-align-left 36-align-left 37-align-left 38-align-right 39-align-left 41-align-left 42-align-right 43-align-left 44-align-left 45-align-left 46-align-right 47-align-left 49-align-left 50-align-right 51-align-left 52-align-left 53-align-left 54-align-right 55-align-left 57-align-left 58-align-right 59-align-left 60-align-left 61-align-left 62-align-right 63-align-left 65-align-left 66-align-right 67-align-left 68-align-left 69-align-left 70-align-right 71-align-left 73-align-left 74-align-right 75-align-left 76-align-left 77-align-left 78-align-right 79-align-left 81-align-left 82-align-right 83-align-left 84-align-left 85-align-left 86-align-right 87-align-left 89-align-left 90-align-right 91-align-left 92-align-left 93-align-left 94-align-right 95-align-left 97-align-left 98-align-right 99-align-left 100-align-left 101-align-left 102-align-right 103-align-left 105-align-left 106-align-right 107-align-left 108-align-left 109-align-left 110-align-right 111-align-left 113-align-left 114-align-right 115-align-left 116-align-left 117-align-left 118-align-right 119-align-left 121-align-left 122-align-right 123-align-left 124-align-left 125-align-left 126-align-right 127-align-left 129-align-left 130-align-right 131-align-left 132-align-left 133-align-left 134-align-right 135-align-left 137-align-left 138-align-right 139-align-left 140-align-left 141-align-left 142-align-right 143-align-left 145-align-left 146-align-right 147-align-left 148-align-left 149-align-left 150-align-right 151-align-left 153-align-left 154-align-right 155-align-left 156-align-left 157-align-left 158-align-right 159-align-left 161-align-left 162-align-right 163-align-left 164-align-left 165-align-left 166-align-right 167-align-left | ||||||
|---|---|---|---|---|---|---|
| timestamp | id | pagename | personid | trackingcode | orders | revenueamount |
| 2025-03-06T19:15:39+00:00 | 10001 | home page | person-1abc123 | abc123 | ||
| 2025-03-06T19:15:39+00:00 | 10002 | confirmation page | person-1abc123 | 1 | 174.25 | |
| 2025-03-06T19:15:39+00:00 | 10003 | home page | person-2def123 | def123 | ||
| 2025-03-06T19:15:39+00:00 | 10004 | home page | person-3ghi123 | ghi123 | ||
| 2025-03-06T19:15:39+00:00 | 10005 | confirmation page | person-3ghi123 | 1 | 149.25 | |
| 2025-03-06T19:15:39+00:00 | 10006 | home page | person-4abc456 | abc456 | ||
| 2025-03-06T19:15:39+00:00 | 10007 | home page | person-5def456 | def456 | ||
| 2025-03-06T19:15:39+00:00 | 10008 | home page | person-6ghi456 | ghi456 | ||
| 2025-03-06T19:15:39+00:00 | 10009 | confirmation page | person-6ghi456 | 1 | 159.25 | |
| 2025-03-06T19:15:39+00:00 | 10010 | home page | person-7abc789 | abc789 | ||
| 2025-03-06T19:15:39+00:00 | 10011 | home page | person-8def789 | def789 | ||
| 2025-03-06T19:15:39+00:00 | 10012 | home page | person-9ghi789 | ghi789 | ||
| 2025-03-06T19:15:39+00:00 | 10013 | confirmation page | person-9ghi789 | 1 | 124.25 | |
| 2025-03-06T19:15:39+00:00 | 10014 | home page | person-10abc987 | abc987 | ||
| 2025-03-06T19:15:39+00:00 | 10015 | home page | person-11def987 | def987 | ||
| 2025-03-06T19:15:39+00:00 | 10016 | home page | person-12ghi987 | ghi987 | ||
| 2025-03-06T19:15:39+00:00 | 10017 | home page | person-13abc654 | abc654 | ||
| 2025-03-06T19:15:39+00:00 | 10018 | home page | person-14def654 | def654 | ||
| 2025-03-06T19:15:39+00:00 | 10019 | home page | person-15ghi654 | ghi654 | ||
| 2025-03-06T19:15:39+00:00 | 10020 | confirmation page | person-15ghi654 | 1 | 174.25 |
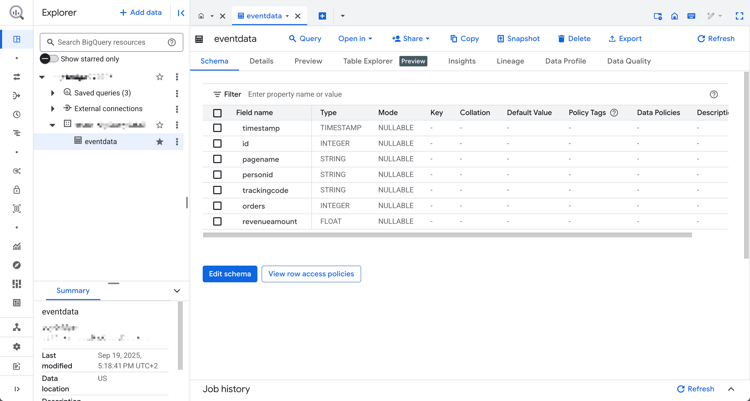
The data is stored in a database table with an associated schema. To inspect the database table:
-
Log in to Google BigQuery.
-
Select BigQuery > Studio.
-
Select your project, dataset and table. In the Schema tab, you see an overview of the schema for the event data.
To inspect the data:
-
Select Query.
-
Run a sample query in the query editor, where
projectis the name of your project anddatasetsis the name of your datasets:code language-sql SELECT * FROM `project.datasets.eventdata` LIMIT 100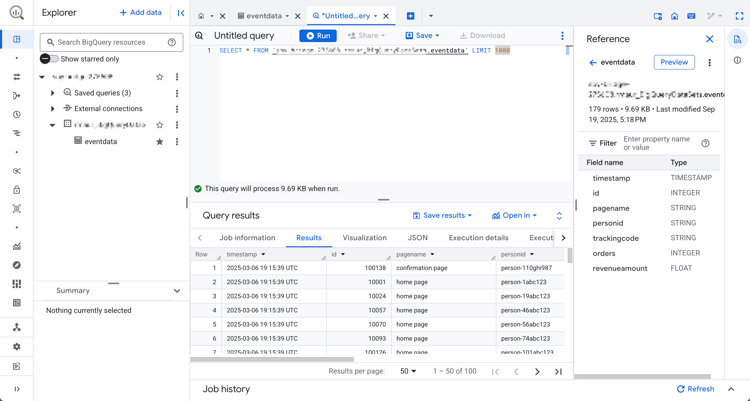
For Experience Platform Data Mirror for Customer Journey Analytics, the tables in your data warehouse native solution must be enabled for change history. To verify that the table is enabled for change history:
-
Run the following SQL statement in the query editor to check the setting, where
projectis the name of your project anddatasetsis the name of your datasets:code language-sql SELECT table_name, MAX(CASE WHEN option_name = 'enable_change_history' THEN option_value END) AS enable_change_history FROM `project.datasets.INFORMATION_SCHEMA.TABLE_OPTIONS` WHERE table_name = 'eventdata' GROUP BY table_name ORDER BY table_name; -
If the result is not TRUE, use the following SQL statement to enable change history, where
projectis the name of your project anddatasetsis the name of your datasets:code language-sql ALTER TABLE `project.datasets.eventdata` SET OPTIONS (enable_change_history = TRUE);
The data in the table in your data warehouse native solution is ready for Experience Platform Data Mirror for Customer Journey Analytics.
Set up a schema
To mirror data in Experience Platform, you first must define the schema for the data. All data that you want to mirror in Experience Platform and that uses Experience Platform Data Mirror for Customer Journey Analytics must conform to a model-based schema.
Define a schema that models this data. To set up your schema:
-
In the Adobe Experience Platform UI, in the left rail, select Schemas within Data Management.
-
Select Create schema.
-
From the drop-down menu, select Model-based.
-
If you see a popup with the option to select between Create manually or Upload a DDL file:
-
Select select Create manually.
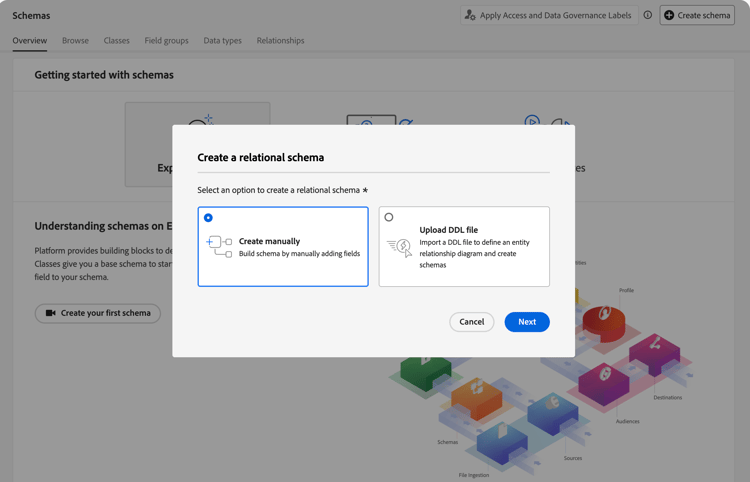
-
Select Next.
-
-
In the Schemas > Create model-based schema interface:
-
Enter a Schema display name. For example:
Sample Event Feed Schema. -
Enter a Description. For example:
Sample event feed schema for a model-based schema. -
Select Time series as the Schema behavior. You select Time series for time-series based data and Record for record based data. The behavior defines the structure of the schema and the properties that are included.
Experience Platform Data Mirror for Customer Journey Analytics is mostly used for time series data (for example, event data).
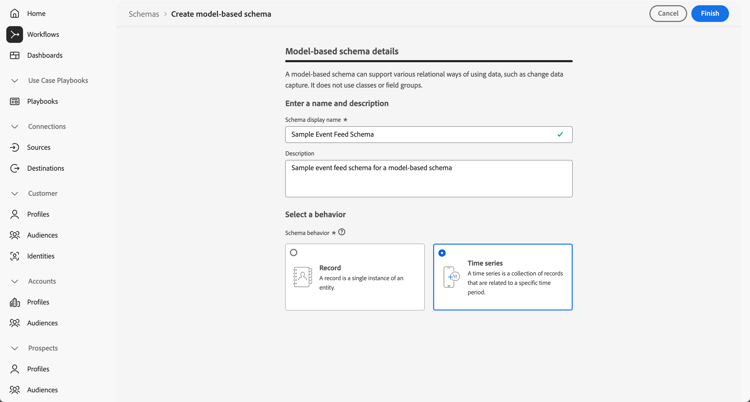
-
Select Finish.
-
-
In the Schemas > Sample Event Feed Schema interface, you see a warning that model-based schemas support ingestion as change rows.
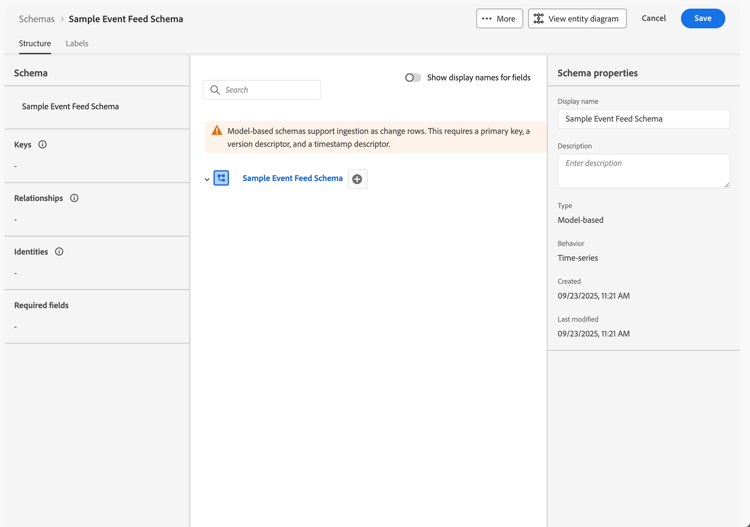
Ingestion as change rows is also known as change data capture (CDC). To support change data capture, the schema requires:
- Primary key.
- Version descriptor.
- Timestamp descriptor for time-series data.
-
Select

table 0-row-4 1-row-4 2-row-4 3-row-4 4-row-4 5-row-4 6-row-4 7-row-4 Field name Display name Type Additional attributes idIdInteger 
ordersOrdersInteger pagenamePage NameString personidPerson IdString
Select CRMID for Identity namespace.revenueamountRevenue AmountDouble timestampTimestampDateTime trackingcodeTracking CodeString -
The id field is configured as Version descriptor.
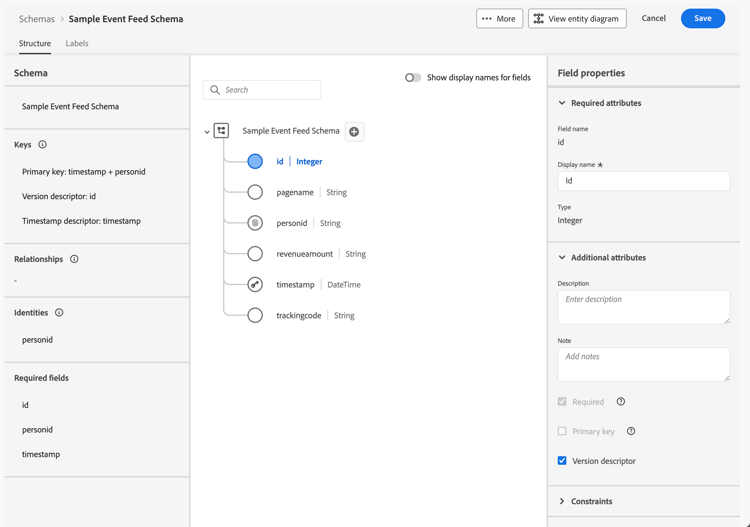
-
The personid field is configured, together with timestamp as the Primary key. Select

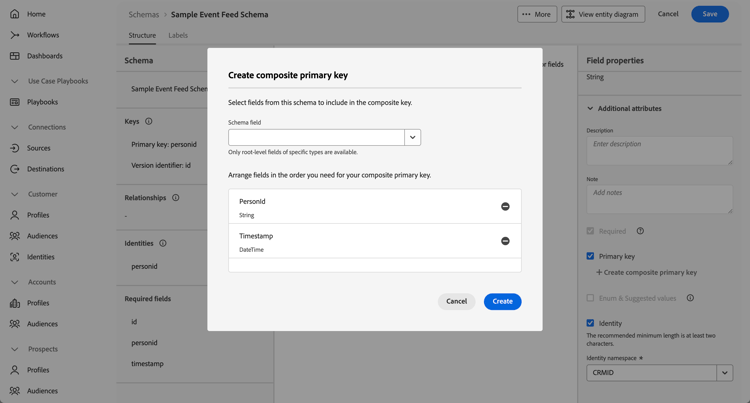
The personid field is also configured as an Identity, with CRMID as the Identity namespace.
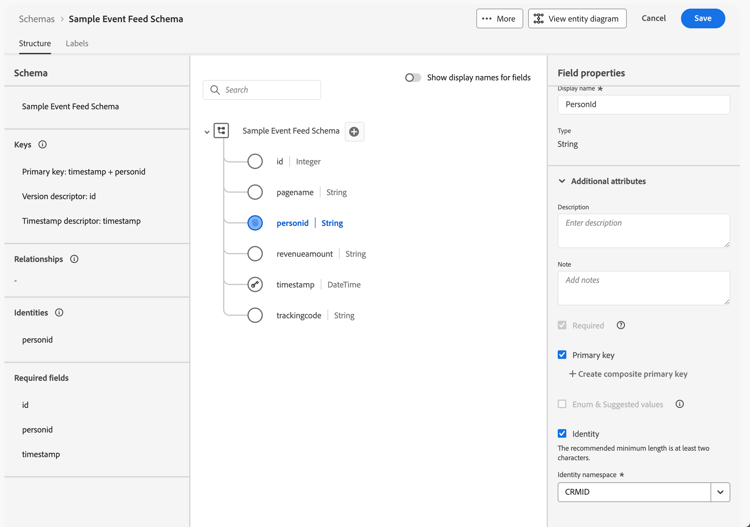
-
The timestamp field is configured, together with personid field as the Primary key. The timestamp field is also configured as Timestamp descriptor. You only need to define a field as Timestamp descriptor for time series model-based data.
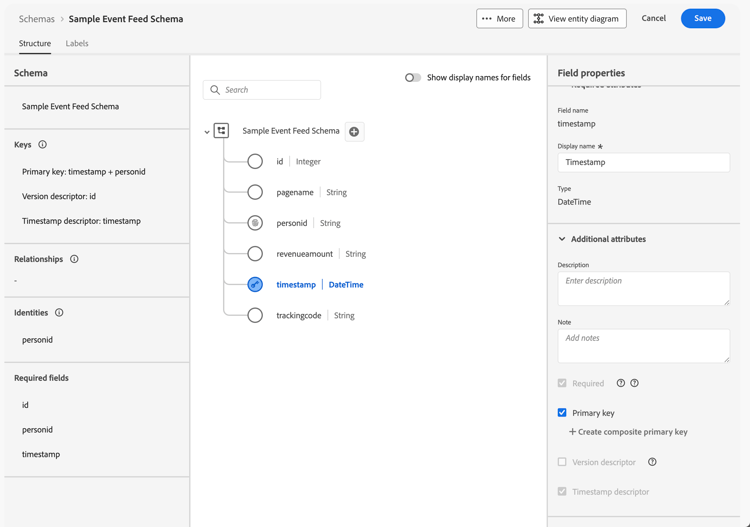
If you have defined Primary key, Version descriptor and Timestamp descriptor correctly, the warning on top of the schema definition disappears.
-
-
Select Save to save your schema.
Use a source connector
You use a source connector to connect the data warehouse native solution to Experience Platform.
In the Experience Platform interface:
- Select Sources.
- Select or search for Google BigQuery.
- Select Add data.
The Add data wizard guides you through the following steps to connect the data from the table in Google BigQuery to Experience Platform.
Authentication
In the Authentication step, select:
-
Existing account when you have already an account setup for Google BigQuery. Continue to the Select data step.
-
New account when you need to connect to Google BigQuery.
-
Specify an Account name and (optional) Description.
-
Select your Authentication type: Basic Authentication or Service Authentication. Based on your selection, provide the required input.
-
Select Connect to source
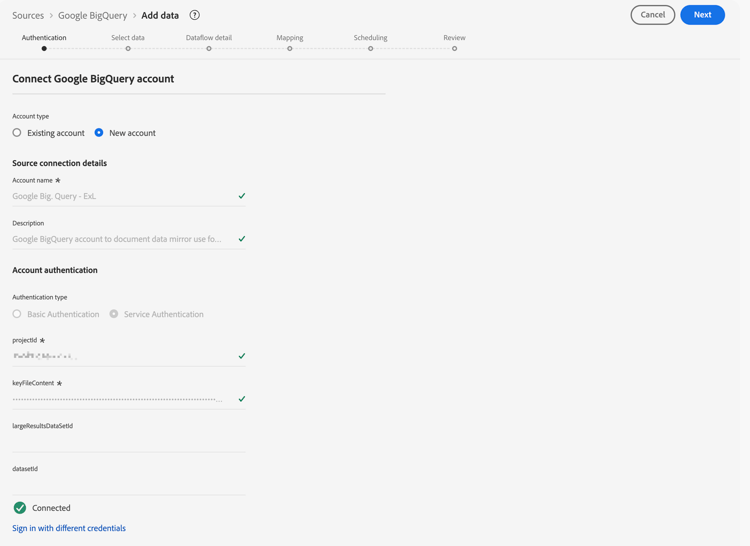
Your connection is verified. A

-
Select Next.
See the Experience Platform documentation for details on how to connect and authenticate when you use the Azure Databricks or Snowflake connector.
-
Select data
In the Select data step:
-
Select the table from the list of tables. For example: eventdata.
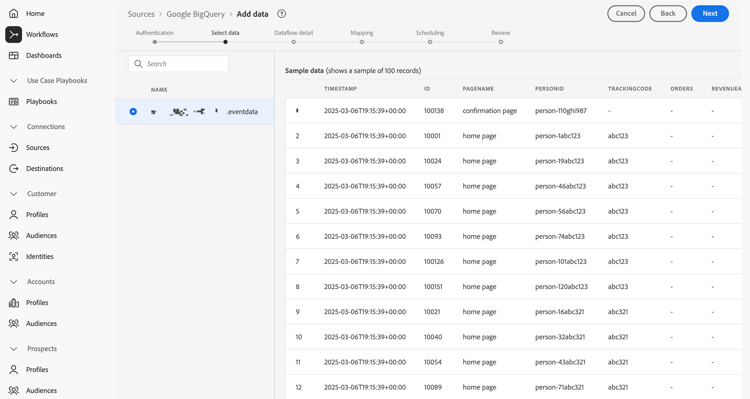
You see a sample of the data displayed for verification.
-
Select Next to continue.
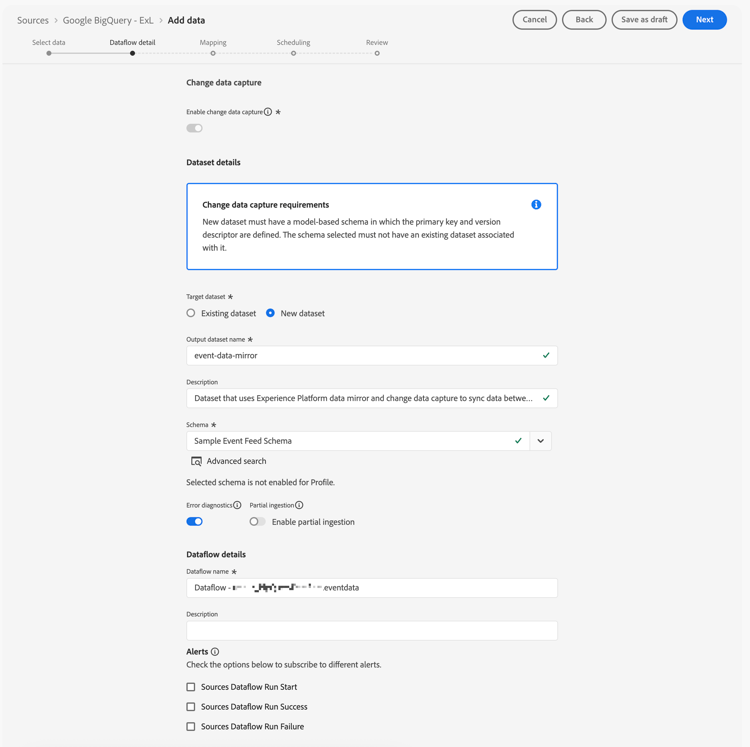
Dataflow detail
In the Dataflow detail step:
-
Select Enable change data capture. A Change data capture requirement information box displays with more information.
-
Select New dataset for Target dataset to create a new dataset that contains the mirrored data.
-
Enter an Output dataset name. For example:
event-data-mirror. -
Select the model-based schema that you created earlier from the Schema drop-down menu. For example: Sample Event Feed Schema.
-
Specify other details.
-
Select Next.
Mapping
In the Mapping step:
-
Map the fields. From the schema in Google BigQuery (Source data) to the fields in the schema that you have defined in Experience Platform (Target fields).
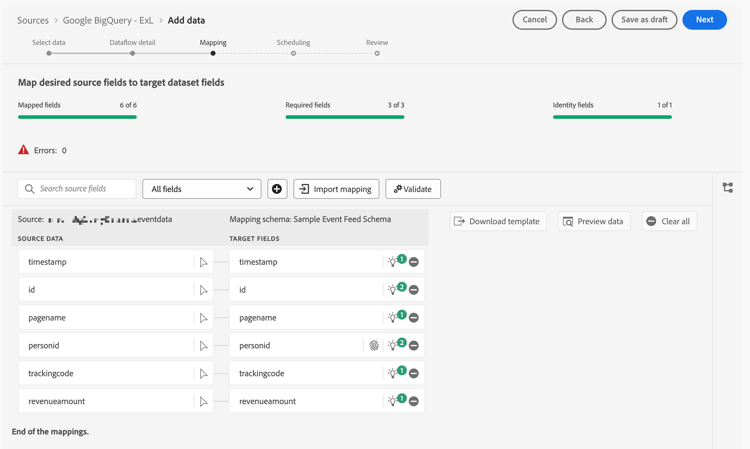
-
If all fields are mapped correctly, select Next to continue.
Scheduling
In the Scheduling step:
-
Specify the Frequency and Interval to schedule the synchronization of the mirrored data.
-
Specify the Start time for the schedule.
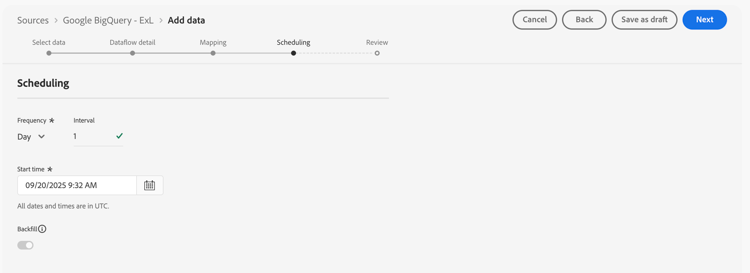
-
Select Next to continue.
Review
In the Review step.
-
Review the configuration for the source connector.
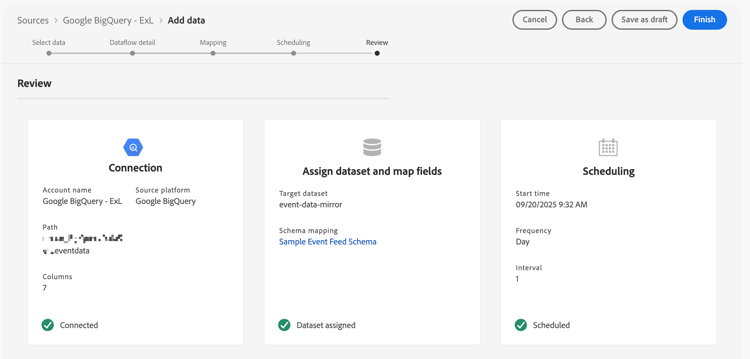
-
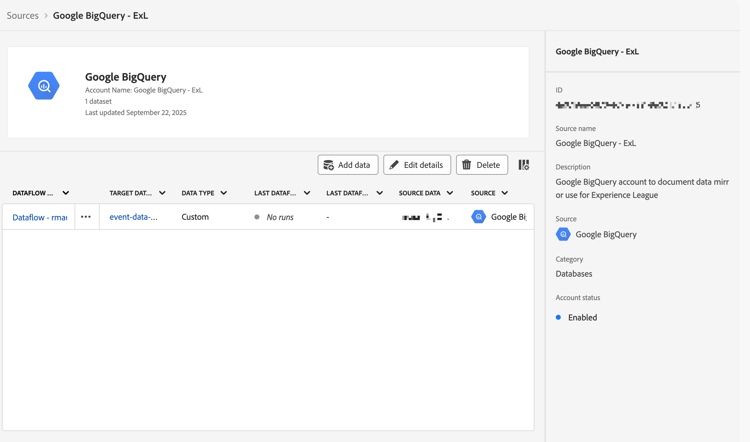
Select Finish. You are directed to the configured dataflow.
Set up a connection
In this quick start guide, you create a new connection to use the mirrored data from Experience Platform. Alternatively you can add the mirrored data to an existing connection.
In the Customer Journey Analytics interface:
-
Select Connections from the Data Management menu.
-
Select Create new connection.
-
Specify the required Connection name, Sandbox, Average number of daily evens, and other optional parameters.
-
Select Add datasets.
-
In the Select datasets step of Add datasets:
-
Select the dataset that contains the mirrored data. For example: event-data-mirror. The dataset has Model as the Dataset type.
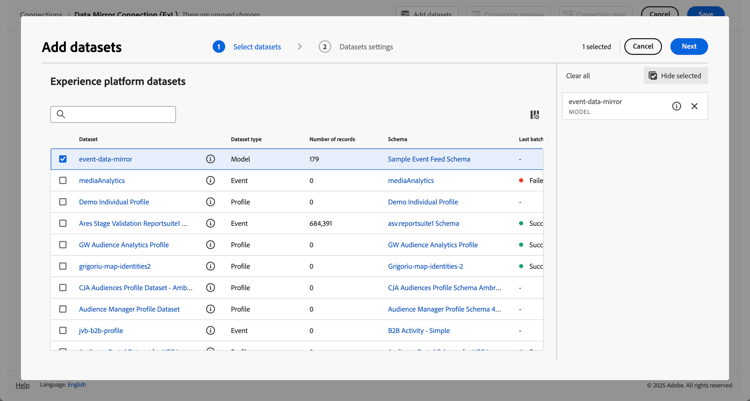
-
Add any additional datasets that are relevant for the connection.
-
Select Next.
-
-
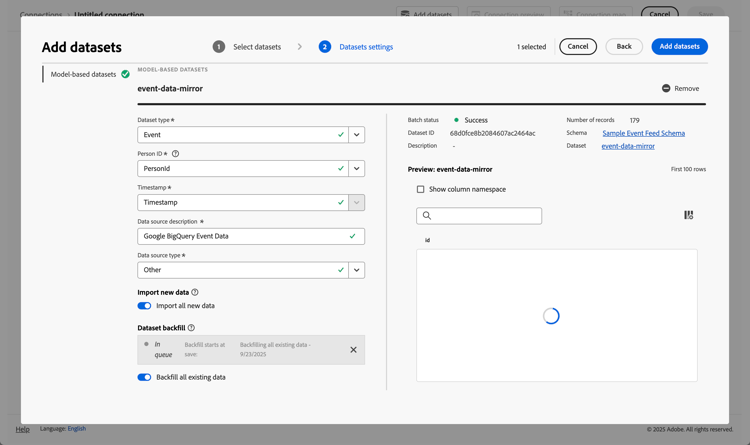
In the Dataset settings step of Add datasets:
For the event-data-mirror model-based dataset
-
Select Event as the Dataset type.
-
Select the PersonId field as the Person ID.
-
Timestamp is automatically populated as the Timestamp.
-
Select Other as the Data source type.
-
Enter
Google BigQuery Event Dataas the Data source description. -
Specify other details, like Import all new data and Backfill all existing data.
Optionally, specify details for other datasets.
-
-
Select Add datasets.
-
-
Select Save.
After you create a connection, you can perform various management tasks. Such as selecting and combining datasets, checking the status of a connection’s datasets and the status of data ingestion, and more.
Set up a data view
To create your data view:
-
In the Customer Journey Analytics interface, select Data views, optionally from Data management, in the top menu.
-
Select Create new data view.
-
In the Configure step:
-
Select your connection from the Connection list.
-
Name and (optionally) describe your connection.
-
Select Save and continue.
-
-
In the Components step:
-
Add any schema field and/or standard component that you want to include to the METRICS or DIMENSIONS component boxes. Ensure you add relevant fields from the dataset that contains the mirrored data. To access those fields:
-
Select Event datasets.
-
Select Adhoc & Model-based fields.
-
Drag and drop fields from the model-based schemas onto METRICS or DIMENSIONS.
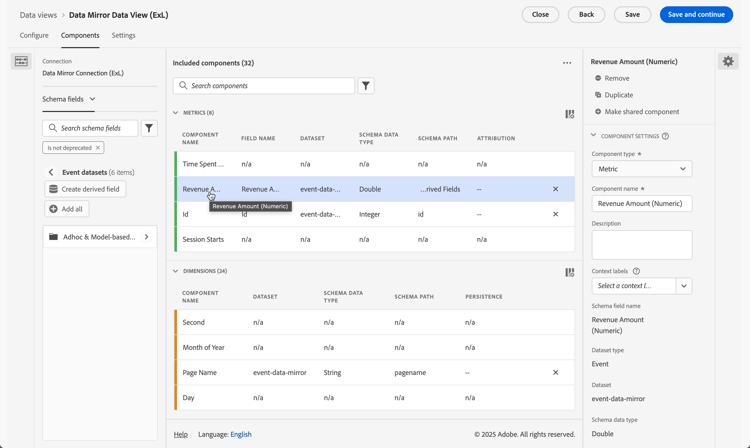
-
-
Define derived fields for fields that do not have the proper type, are not in the proper format, or you want to modify for other reasons. For example, for Revenue Amount.
-
Select Create derived field.
-
In the derived field editor:
-
Define a new
Revenue Amount (Numeric)field, like below.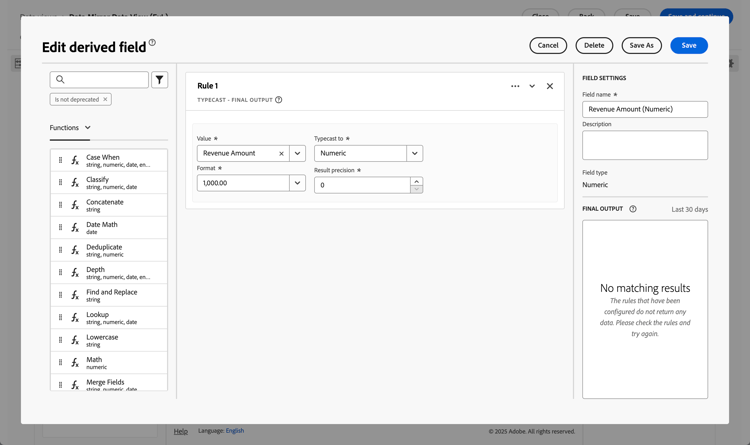
-
Select Save.
-
-
Drag the new Revenue Amount (Numeric) derived field and drop the field in METRICS.
-
-
Select Save and continue.
-
-
In the Settings step:
Leave the settings as they are and select Save and finish.
See Data views overview for more information on how to create and edit a data view. And what components are available for you to use in your data view and how to use segment and sessions settings.
Set up a project
Analysis Workspace is a flexible browser tool that allows you to build analyses quickly and share insights based on your data. You use Workspace projects to combine data components, tables, and visualizations to craft your analysis and share with anyone in your organization.
To create your project:
-
In the Customer Journey Analytics interface, select Workspace in the top menu.
-
Select Projects in the left navigation.
-
Select Create project. In the popup:
-
Select Blank Workspace project.
-
Select Create.
-
-
In the New project workspace, ensure that your data view is selected. That data view links to the connection that contains the mirrored data.
-
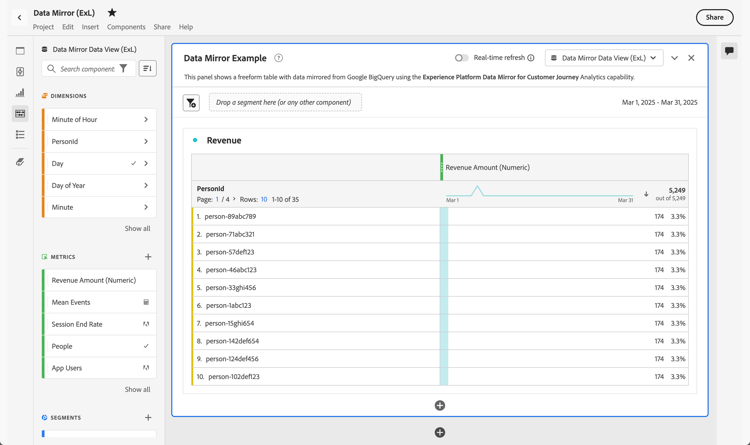
To create your first report, drag and drop dimensions and metrics on the Freeform table in the Freeform panel. For example, drag Revenue Amount (Numeric) onto Drag a metric here. And drag PersonId and drop the field on the first column header. Make some other adjustments as you see fit.
The final result is an overview of profiles and their revenues based on mirrored data originating from a Google BigQuery table.
See Analysis Workspace overview for more information on how to create projects and build your analysis using components, visualizations, and panels.