Get started with Observability Insights get-started
This section covers the essentials for new users: how to access your Observability Insights account, what environments and data Adobe monitors on your behalf, and how to navigate the rest of this documentation.
The Observability Insights interface observability-insights-interface
When you sign in at insights.adobecqms.net, the opening screen gives you an entry point into all monitoring areas for your AEM Managed Services environments.
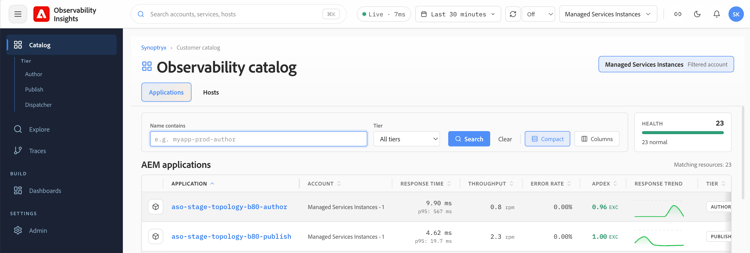
The interface is organized around two core monitoring areas:
- Applications — Displays application performance data for your Author and Publish tiers. Use this to investigate request throughput, error rates, latency, JVM behavior, and trace-level execution details. See Applications.
- Hosts — Displays host-level health data across your managed topology. Use this to assess CPU, memory, disk, network, and storage signals on individual servers. See Hosts.
Both areas are read-only for customer users. Adobe Managed Services manages account provisioning, instrumentation, and administrative control.
Access and account management access-overview
Observability Insights access is managed through Adobe IMS. Adobe provisions and manages your organization’s account; customer teams receive read-only access to all monitored data.
Key points:
- Your organization’s Observability Insights account is linked to a single Adobe master account.
- All environments in your Managed Services contract—Author and Publish, production and non-production—report into this account.
- User access is provisioned and managed by your Customer Success Engineer (CSE).
For provisioning steps, user roles, and what customer users can and cannot do, see Access and account management.
Coverage, environments, and data retention coverage-overview
Adobe monitors your AEM Author and Publish tiers using the Observability Insights APM Java plug-in, and all hosted servers using the Observability Insights Infrastructure agent. Monitoring is enabled in both non-production and production environments.
Key points:
- Each AEM Managed Services environment includes one APM application for Author and one for Publish.
- APM metrics, infrastructure metrics, and events are retained for up to 30 days.
- Observability Insights is suited to operational analysis and recent trend comparison; it is not an archival or long-term reporting tool. Capture screenshots or exported evidence before data ages out.
For full coverage details—including how applications are represented in your account and operational implications of the retention window—see Coverage, environments, and data retention.
How this guide is structured how-this-guide-is-structured
The documentation is organized into four areas. Use the descriptions below to go directly to what you need.
Get started — This section. Covers access, account provisioning, monitoring scope, and data retention.
Use Observability Insights — Task-oriented guidance for day-to-day investigation. Use Applications when the symptom is application-facing: slow pages, error spikes, or unstable transactions. Use Hosts when you need to determine whether host-level resource pressure—CPU, memory, disk, or network—explains what you are seeing in Applications. Step-by-step investigation flows are available in Investigate application issues and Investigate infrastructure issues.
Frequently Asked Questions — Common questions and support-oriented entry points for when you are unsure where to begin or need quick answers during an active incident.