Use Observability Insights use-observability-insights
This section covers the day-to-day monitoring and investigation workflows your team uses most, organized around two monitoring areas: Application Performance Monitoring and Infrastructure monitoring.
The Observability Insights interface observability-insights-interface
The Observability Insights left navigation panel gives you access to all monitoring areas for your AEM Managed Services environments.
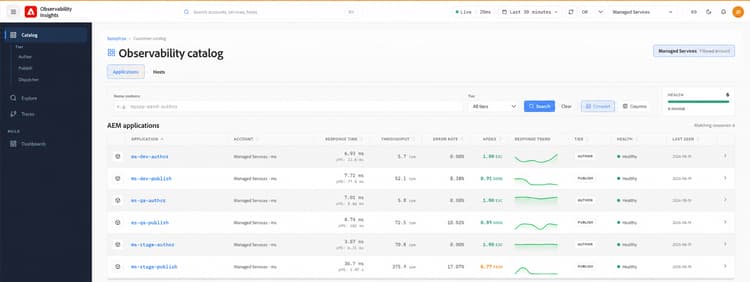
The navigation includes:
-
Catalog — Central inventory of monitored AEM applications and hosts. Browse resources across Author, Publish, and Dispatcher tiers, with at-a-glance health and key performance indicators such as response time, throughput, error rate, and Apdex.
-
Explore — Investigate observability telemetry and drill into performance data across monitored resources.
-
Traces — Analyze end-to-end application transactions and request traces to identify latency, errors, and performance bottlenecks.
-
Dashboards — Access curated dashboards for deeper visualization and monitoring of application and infrastructure signals.
Resources can be filtered by account and tier, while the catalog provides a consolidated view of application and host health across the managed AEM topology.
Applications applications
Use Applications when the issue is application-facing — slow pages, rising error rates, unstable transactions, or unexpected latency on Author or Publish.
Applications helps you answer:
- Is the issue isolated to Author, Publish, or affecting both tiers?
- Which endpoints or transactions contribute most to traffic and slowdowns?
- Did latency or errors change before or after a deployment or traffic spike?
- Do traces point to repository operations, external dependencies, or JVM pressure?
Applications instruments AEM transactions down to method calls, external dependencies, and repository operations, so you can move quickly from a broad symptom to a specific execution path.
Hosts hosts
Use Hosts when you need to determine whether application behavior is caused or compounded by host resource conditions — CPU saturation, memory pressure, disk I/O, network throughput, or storage capacity.
Host monitoring helps you answer:
- Is the application slowdown accompanied by CPU, memory, or I/O pressure at the host level?
- Is one host behaving differently from others in the same environment?
- Are disk or storage utilization trends pointing to an upcoming capacity problem?
- Do infrastructure patterns explain the application behavior, or are they a downstream effect?
Use host dashboards alongside applications to distinguish between application-level regressions and environment-level resource constraints.
Both articles include investigation workflows, questions to guide your triage, and a list of evidence to capture when escalating to Adobe Managed Services.