在此頁面上:監視您歷程對協力廠商系統發出之API呼叫的可靠性和效能,以便快速找出整合問題、延遲和節流限制。
自訂動作報告頁面可讓您監視從歷程對第三方系統發出的API呼叫的可靠性和效能。 這些報告可協助您快速識別可能影響傳送的整合問題、延遲瓶頸或節流/上限限制。
「自訂動作」報表頁面的功能與Journey Optimizer中的其他所有時間報表相同。 如需儀表板功能的詳細資訊,請參閱本檔案。
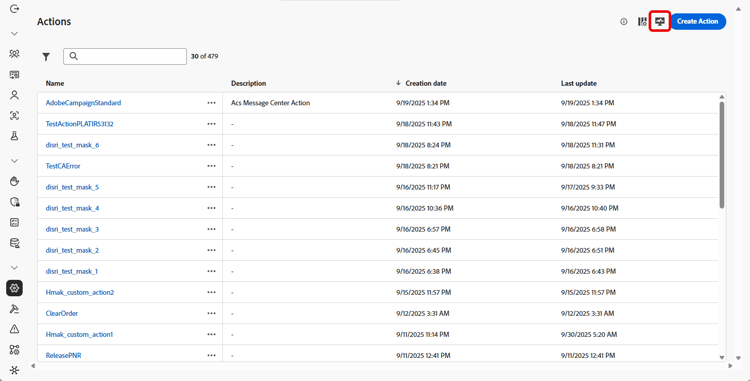
若要存取 自訂動作 報告頁面,請從您的 動作 首頁中按一下

➡️ 進一步瞭解自訂動作組態
除了 自訂動作 報告頁面之外,您也可以使用 Adobe Experience Platform Query Service 來建置查詢,以報告自訂動作效能測量結果。 此區段中有查詢範例。
KPI kpis
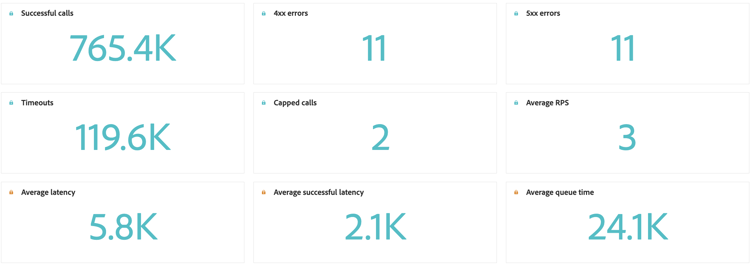
自訂動作關鍵績效指標(KPI)可作為集中式儀表板,提供自訂動作呼叫的運作狀況與可靠性的整合檢視。 這些量度可讓您評估效能、找出瓶頸,並確保與外部系統的穩定整合。
-
成功的呼叫:傳回有效回應且沒有錯誤的HTTP呼叫總數。
-
4xx/5xx錯誤:由於使用者端(4xx)或伺服器端(5xx)錯誤,強調設定問題或端點失敗而失敗的呼叫數目。
-
逾時:因超過最大回應時間而失敗的呼叫數。 這有助於顯示外部端點的延遲或效能問題。
-
已設定上限:由於上限限制而被封鎖的呼叫數目,可確保下游系統不會超載。
-
平均RPS:在選取的時間範圍內,自訂動作每秒處理的要求數目。
-
平均延遲:所有HTTP呼叫的平均端對端回應時間(以毫秒為單位),包括成功的呼叫、錯誤和逾時。
-
平均成功延遲:僅成功呼叫的平均端對端回應時間(毫秒),不包括失敗的要求與逾時。
-
平均佇列時間:呼叫在傳送之前在執行佇列中等待的平均時間(毫秒)。 這僅適用於節流端點,當達到輸送量限制時,Journey Optimizer會將呼叫排入佇列。
一段時間內的通話 calls
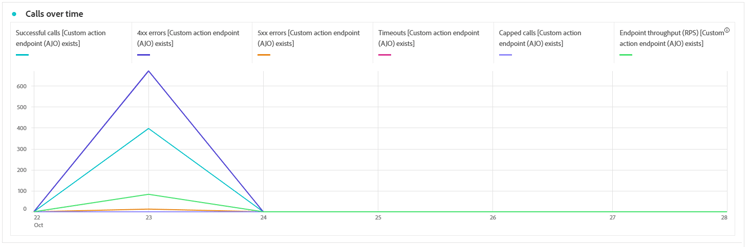
一段時間內的呼叫圖表顯示報告所選時段內的HTTP呼叫KPI趨勢。 時間序列的詳細程度取決於所選的時間範圍。 例如:
- 對於7天報表,每個資料點都會顯示一天的KPI。
- 如果您選取1天時間範圍,圖表會顯示每小時的KPI。
- 如果您選取1小時時間範圍,圖表將顯示每分鐘的KPI。
一段時間的延遲 latency-overtime
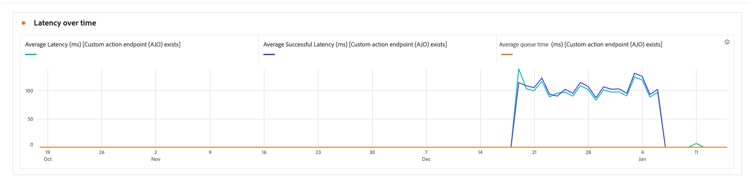
一段時間內的延遲圖表可顯示所選時段內的延遲量度趨勢。 此時間序列檢視可讓您追蹤效能模式、識別尖峰延遲期間,以及監視最佳化或系統變更隨時間流逝的影響。
呼叫劃分 breakdown
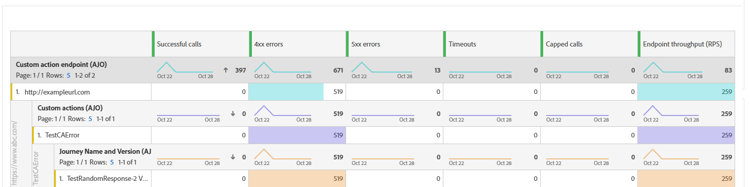
呼叫劃分表格提供HTTP呼叫量度的階層式劃分,從最上層每個端點的整體量度,到使用每個端點的每個自訂動作的量度,再到最底層依賴這些量度的歷程。
延遲劃分 latency-breakdown
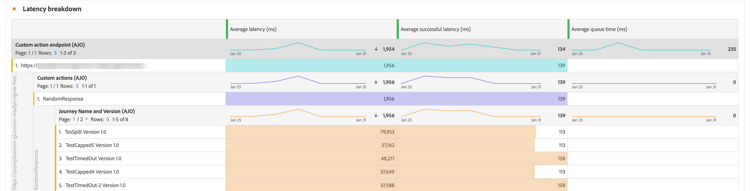
延遲劃分表格提供自訂動作延遲量度的詳細劃分。 此檢視可協助您識別哪些特定端點或動作發生效能問題,讓您有效找出並解決延遲瓶頸。
作法影片 video
以下影片說明如何監視從您的歷程對第三方系統進行API呼叫的可靠性和效能。
This section contains structured knowledge intended to support interpretation, retrieval, and question answering related to this topic.
For complete understanding, this information should be combined with the documentation on this page. Neither source is intended to stand alone; the page describes the feature, while this section provides additional context that helps disambiguate terminology, intent, applicability, and constraints.
- TL;DR: This page explains how to use the Custom action reporting page to monitor the reliability and performance of the API calls your journeys make to third-party systems.
Intents:
- Access the Custom action reporting page from the Actions homepage
- Review the Custom action KPIs for operational health and reliability
- Track HTTP call KPI trends over time with the Calls over time graph
- Analyze latency patterns with the Latency over time graph
- Drill into metrics per endpoint, custom action, and journey with the breakdown tables
Glossary:
- Custom action reporting page: The reporting page that lets you monitor the reliability and performance of API calls made from your journeys to third-party systems; it functions like other All-time reports (product-specific)
- Capped calls: Number of calls that were blocked due to capping limits, ensuring downstream systems are not overloaded (product-specific)
- Average queue time: Average time (in milliseconds) calls spent waiting in the execution queue before being sent (product-specific)
- Calls breakdown: A hierarchical table breaking metrics down from per endpoint, to per Custom Action using each endpoint, to the journeys that rely on them (product-specific)
Guardrails:
- Average queue time only applies to throttled endpoints, where Journey Optimizer queues up calls when the throughput limit is reached.
- Average latency covers all HTTP calls, including successful calls, errors, and timeouts, while Average successful latency covers successful calls only, excluding failed requests and timeouts.
- The granularity of the Calls over time series depends on the selected time range: a 7 day report shows KPIs per day, a 1-day time range shows KPIs per hour, and a 1-hour time range shows KPIs per minute.
Terminology:
- Canonical name: Custom action reporting page — Acronym: n/a — variants: Custom action report
- Synonyms: “Average RPS” = “requests per second processed by the custom action over the selected time range”
- Do not confuse: “4xx/5xx errors” (failed calls due to client-side or server-side errors) ≠ “Timeouts” (calls that exceeded the maximum response time) ≠ “Capped calls” (calls blocked due to capping limits)
- Do not confuse: “Average latency” (all HTTP calls) ≠ “Average successful latency” (successful calls only)
FAQ:
- Q: What does the Custom action reporting page monitor? — It monitors the reliability and performance of API calls made from your journeys to third-party systems, helping you identify integration issues, latency bottlenecks, or throttling and capping limits.
- Q: How do I access the Custom action reporting page? — Click the Monitoring icon from your Actions homepage.
- Q: What is the difference between Average latency and Average successful latency? — Average latency is the average response time for all HTTP calls including successful calls, errors, and timeouts, while Average successful latency is for successful calls only, excluding failed requests and timeouts.
- Q: When does Average queue time apply? — It only applies to throttled endpoints, where Journey Optimizer queues up calls when the throughput limit is reached.
- Q: Can I report on custom action performance outside this page? — Yes, you can use Adobe Experience Platform Query Service to build queries on custom action performance metrics.