이 페이지에서: 여정이 서드파티 시스템에 대해 수행하는 API 호출의 안정성과 성능을 모니터링하여 통합 문제, 지연 및 제한 제한을 빠르게 확인할 수 있습니다.
사용자 지정 작업 보고 페이지에서는 여정에서 서드파티 시스템으로 전송되는 API 호출의 안정성과 성능을 모니터링할 수 있습니다. 이러한 보고서를 통해 통합에 영향을 미칠 수 있는 문제, 지연 병목 현상 또는 제한/한도 제한을 신속하게 파악할 수 있습니다.
사용자 지정 작업 보고 페이지는 Journey Optimizer의 다른 모든 시간 보고서와 마찬가지로 작동합니다. 대시보드 기능에 대한 자세한 내용은 이 설명서를 참조하세요.
사용자 지정 작업 보고 페이지에 액세스하려면 작업 홈 페이지에서

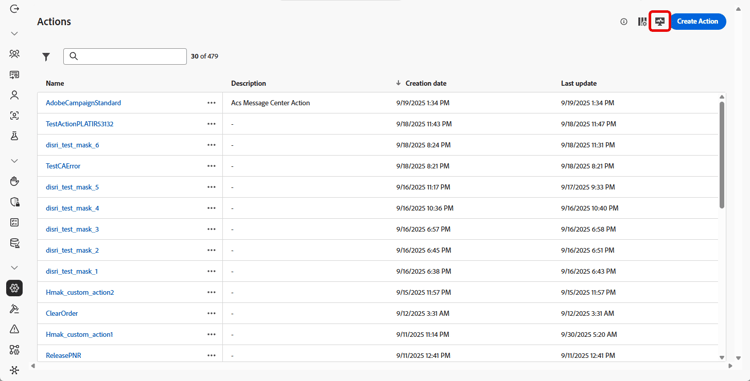
사용자 지정 작업 보고 페이지 외에도 Adobe Experience Platform Query Service을(를) 사용하여 사용자 지정 작업 성능 지표에 대해 보고할 쿼리를 작성할 수 있습니다. 쿼리 예제는 이 섹션에서 사용할 수 있습니다.
KPI kpis
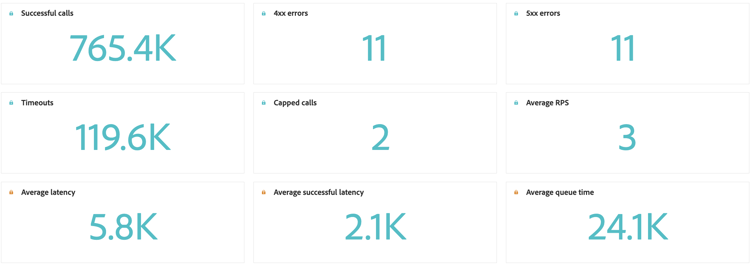
사용자 지정 작업 KPI(주요 성능 지표)는 중앙 집중식 대시보드 역할을 하며 사용자 지정 작업 호출의 작동 상태 및 안정성에 대한 통합된 보기를 제공합니다. 이러한 지표를 통해 성능을 평가하고 병목 현상을 식별하며 외부 시스템과의 안정적인 통합을 보장할 수 있습니다.
-
성공한 호출: 오류 없이 유효한 응답을 반환하는 총 HTTP 호출 수입니다.
-
4xx/5xx 오류: 클라이언트측(4xx) 또는 서버측(5xx) 오류로 인해 실패한 호출 수로, 구성 문제 또는 끝점 오류가 강조 표시됩니다.
-
시간 초과: 최대 응답 시간을 초과하여 실패한 호출 수입니다. 이렇게 하면 외부 끝점과 관련하여 지연 또는 성능 문제를 표면화하는 데 도움이 됩니다.
-
제한된 호출: 제한 제한으로 인해 차단된 호출 수로 다운스트림 시스템이 오버로드되지 않도록 합니다.
-
평균 RPS: 선택한 시간 범위 동안 사용자 지정 작업에서 처리한 초당 요청 수입니다.
-
평균 대기 시간: 성공한 호출, 오류 및 시간 제한을 포함하여 모든 HTTP 호출에 대한 평균 종단 간 응답 시간(밀리초)입니다.
-
성공한 평균 대기 시간: 실패한 요청 및 시간 초과를 제외하고 성공한 호출에 대해서만 평균 전체 응답 시간(밀리초)입니다.
-
평균 큐 시간: 전송하기 전에 실행 큐에서 대기하는 데 걸린 평균 시간(밀리초)입니다. 이는 처리량 제한에 도달했을 때 Journey Optimizer이 호출을 큐에 추가하는 제한된 끝점에만 적용됩니다.
시간 경과에 따른 호출 calls
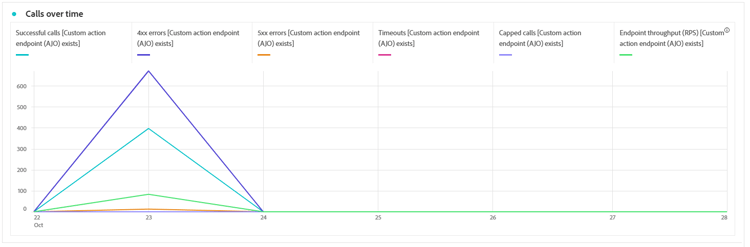
시간 경과에 따른 호출 그래프는 보고서에 대해 선택한 기간 경과에 따른 HTTP 호출 KPI 트렌드를 보여 줍니다. 시계열의 세부기간은 선택한 시간 범위에 따라 다릅니다. 예:
- 7일 보고서의 경우 각 데이터 포인트에 1일의 KPI가 표시됩니다.
- 1일 시간 범위를 선택하면 그래프에 시간당 KPI가 표시됩니다.
- 1시간 시간 범위를 선택하면 그래프에 분당 KPI가 표시됩니다.
➡️HTTP 호출 지표에 대한 설명은 KPI 섹션을 참조하십시오
시간 경과에 따른 지연 latency-overtime
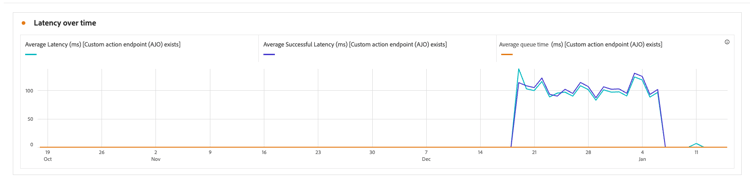
시간 경과에 따른 지연 그래프는 선택한 기간 동안의 지연 지표 트렌드를 시각화합니다. 이 시계열 보기를 통해 성능 패턴을 추적하고 최대 지연 기간을 식별하며 시간에 따른 최적화 또는 시스템 변경의 영향을 모니터링할 수 있습니다.
➡️지연 지표에 대한 설명은 KPI 섹션을 참조하십시오
통화 분류 breakdown
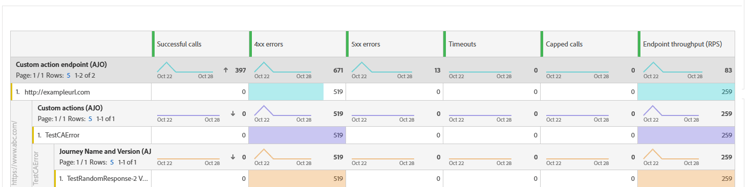
호출 분석 테이블은 최상위 수준의 끝점당 전체 지표부터 각 끝점을 사용하는 사용자 지정 작업당 지표까지 HTTP 호출 지표의 계층 구조 분석을 제공하며 최하위 수준의 여정을 사용합니다.
➡️HTTP 호출 지표에 대한 설명은 KPI 섹션을 참조하십시오
지연 분류 latency-breakdown
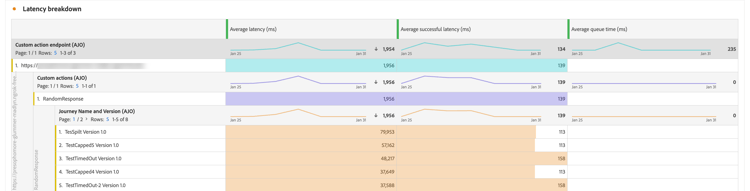
지연 분석 테이블은 사용자 지정 작업 전체에 걸쳐 지연 지표에 대한 자세한 분석을 제공합니다. 이 보기를 통해 성능 문제가 발생하는 특정 엔드포인트 또는 작업을 식별하여 지연 병목 현상을 효과적으로 찾아내고 해결할 수 있습니다.
➡️지연 지표에 대한 설명은 KPI 섹션을 참조하십시오
사용 방법 비디오 video
아래 비디오에서는 서드파티 시스템에 대한 여정에서 수행한 API 호출의 안정성과 성능을 모니터링하는 방법을 보여 줍니다.
This section contains structured knowledge intended to support interpretation, retrieval, and question answering related to this topic.
For complete understanding, this information should be combined with the documentation on this page. Neither source is intended to stand alone; the page describes the feature, while this section provides additional context that helps disambiguate terminology, intent, applicability, and constraints.
- TL;DR: This page explains how to use the Custom action reporting page to monitor the reliability and performance of the API calls your journeys make to third-party systems.
Intents:
- Access the Custom action reporting page from the Actions homepage
- Review the Custom action KPIs for operational health and reliability
- Track HTTP call KPI trends over time with the Calls over time graph
- Analyze latency patterns with the Latency over time graph
- Drill into metrics per endpoint, custom action, and journey with the breakdown tables
Glossary:
- Custom action reporting page: The reporting page that lets you monitor the reliability and performance of API calls made from your journeys to third-party systems; it functions like other All-time reports (product-specific)
- Capped calls: Number of calls that were blocked due to capping limits, ensuring downstream systems are not overloaded (product-specific)
- Average queue time: Average time (in milliseconds) calls spent waiting in the execution queue before being sent (product-specific)
- Calls breakdown: A hierarchical table breaking metrics down from per endpoint, to per Custom Action using each endpoint, to the journeys that rely on them (product-specific)
Guardrails:
- Average queue time only applies to throttled endpoints, where Journey Optimizer queues up calls when the throughput limit is reached.
- Average latency covers all HTTP calls, including successful calls, errors, and timeouts, while Average successful latency covers successful calls only, excluding failed requests and timeouts.
- The granularity of the Calls over time series depends on the selected time range: a 7 day report shows KPIs per day, a 1-day time range shows KPIs per hour, and a 1-hour time range shows KPIs per minute.
Terminology:
- Canonical name: Custom action reporting page — Acronym: n/a — variants: Custom action report
- Synonyms: “Average RPS” = “requests per second processed by the custom action over the selected time range”
- Do not confuse: “4xx/5xx errors” (failed calls due to client-side or server-side errors) ≠ “Timeouts” (calls that exceeded the maximum response time) ≠ “Capped calls” (calls blocked due to capping limits)
- Do not confuse: “Average latency” (all HTTP calls) ≠ “Average successful latency” (successful calls only)
FAQ:
- Q: What does the Custom action reporting page monitor? — It monitors the reliability and performance of API calls made from your journeys to third-party systems, helping you identify integration issues, latency bottlenecks, or throttling and capping limits.
- Q: How do I access the Custom action reporting page? — Click the Monitoring icon from your Actions homepage.
- Q: What is the difference between Average latency and Average successful latency? — Average latency is the average response time for all HTTP calls including successful calls, errors, and timeouts, while Average successful latency is for successful calls only, excluding failed requests and timeouts.
- Q: When does Average queue time apply? — It only applies to throttled endpoints, where Journey Optimizer queues up calls when the throughput limit is reached.
- Q: Can I report on custom action performance outside this page? — Yes, you can use Adobe Experience Platform Query Service to build queries on custom action performance metrics.