Monitor loyalty challenge performance loyalty-reporting
Use Loyalty Challenges reporting to see how your challenges are performing. Check who is signing up, who is completing challenges, and how much revenue your program is generating — all in one place. Data comes from Adobe Customer Journey Analytics.
To open the reporting dashboards, go to Loyalty Challenges in Journey Optimizer and select Performance in the left navigation.
The reporting interface has two tabs:
Reports view reports-view
The Reports tab gives you an overview of how your program is doing for the selected period. Use the date picker at the top of the page and select the Apply filter button to change the reporting period and see updated numbers and charts.
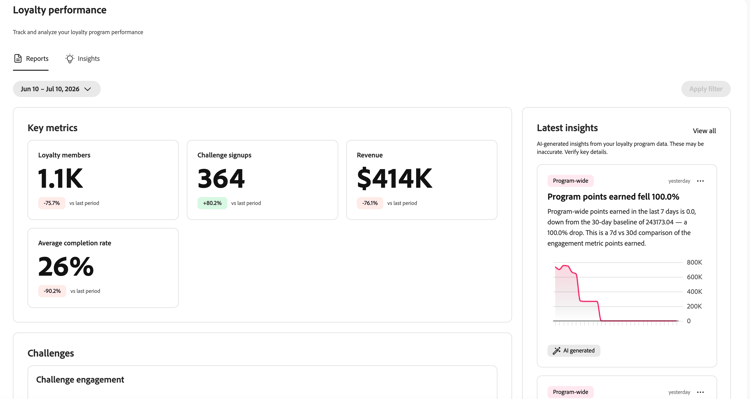
The Key metrics area shows four numbers at a glance. Each metric also displays a percentage change compared to the previous period.
- Loyalty members: How many loyalty members were active during the period.
- Challenge signups: How many times members enrolled in a challenge.
- Revenue: Total revenue tied to challenge activity.
- Average completion rate: The percentage of enrolled members who finished at least one challenge.
The Latest insights panel on the right shows the most recent AI-generated insights from your program. Select View all to open the full Insights tab.
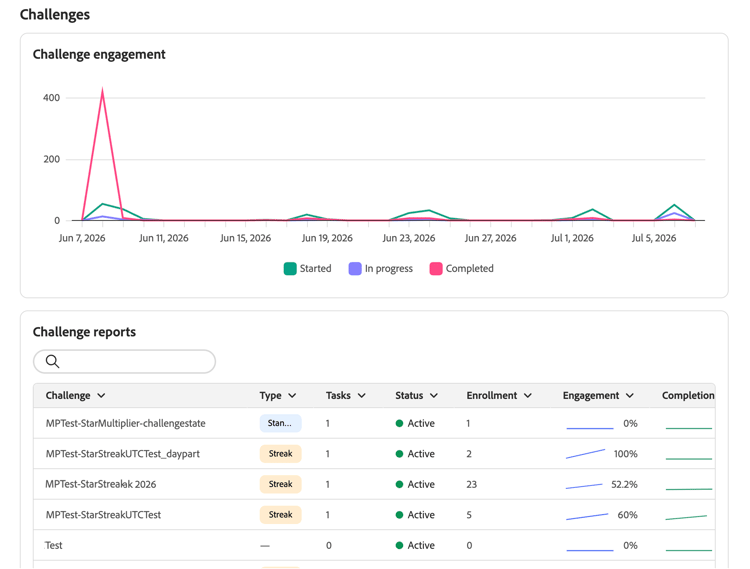
Below the key metrics, the Challenges section gives you two views of challenge activity.
-
Challenge engagement: A timeline showing how many members started, are in progress, and completed challenges over the period.
-
Challenge reports: A table of all your challenges with details like type, tasks, status, and enrollment numbers. Use the search bar to find a specific challenge. Select a challenge to see its full report with engagement trends and performance details.
accordion Challenge report example 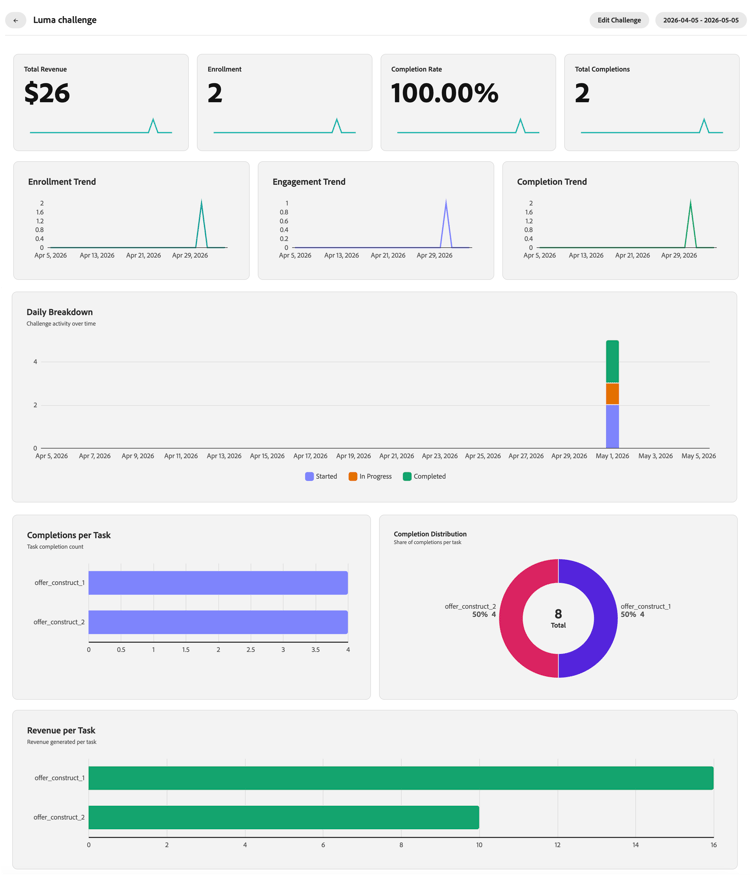
Insights tab insights-cards
The Insights tab surfaces AI-generated cards that flag anomalies, trends, and opportunities in your loyalty program. Each card represents a single observation and is ranked by how significant it is relative to your current program data.
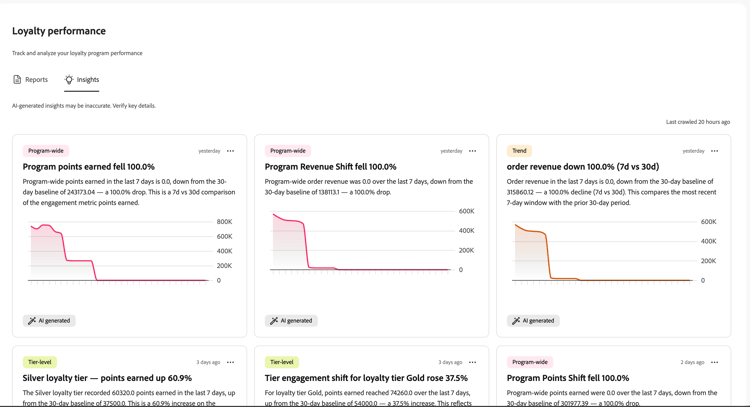
A Last crawled timestamp at the top right shows when the insight engine last processed your program data.
Card actions insight-card-actions
Each card has a

- Dismiss: Permanently removes the card from the insights list.
- Snooze: Hides the card temporarily. Choose to snooze for 1 day, 3 days, or 7 days. The card reappears after the snooze period ends.
Category tags insight-category-tags
Each card carries a category tag that identifies which part of your program the insight relates to.