Usage analysis reference

Use the Usage Insights analysis areas to understand how supported Adobe products and capabilities are being used across your organization. Usage Insights organizes usage data into six analysis areas: Profile analysis, Audience analysis, Destination analysis, Channel analysis, Campaign analysis, and Journey analysis. This reference describes the charts available in each area and the usage information they provide.

Configure analysis settings configure-analysis-settings

Use these settings to control the displayed date range and inspect the applied sandbox segment.

Set the analysis period configure-analysis-period

To change the period displayed in the Usage Insights charts, select the date range in any analysis area. In the date range dialog, select dates from the calendar or choose an available preset.

For more control over the date range, expand the advanced settings. You can configure the start and end times and use rolling dates so that the selected period moves forward automatically over time.

Select Apply to update the current panel, or select Apply to all panels to use the same date range across the Usage Insights analysis areas.
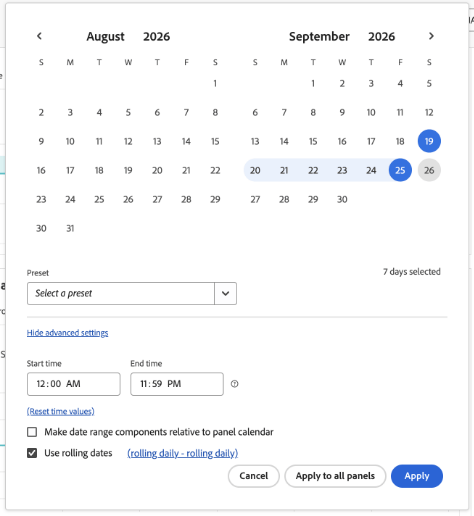
The Usage Insights date range dialog showing calendar selection, preset options, start and end times, rolling date settings, and controls to apply the range to the current or all panels. {modal="regular"}

Understand the sandbox segment sandbox-segment

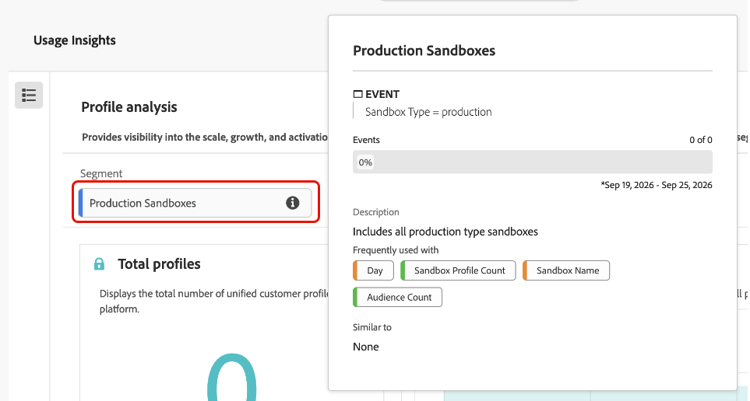
Usage Insights uses a sandbox segment to scope the data shown in each analysis area. The Production Sandboxes segment includes sandboxes where the sandbox type is production.

Select the information icon ( The information icon. ) next to the segment to view its definition and related component information. The details panel shows the segment description and the components that are frequently used with the segment, such as day, sandbox name, profile count, and audience count.

The Production Sandboxes segment details showing its production sandbox definition, description, and related dimensions and metrics. {modal="regular"}

The segment details are informational and do not change the sandbox configuration used by Usage Insights. To change where Usage Insights data is stored, use Data Settings from the Usage Insights dashboard.

Profile analysis profile-analysis

Profile analysis provides visibility into the scale, growth, and activation readiness of unified customer profiles.
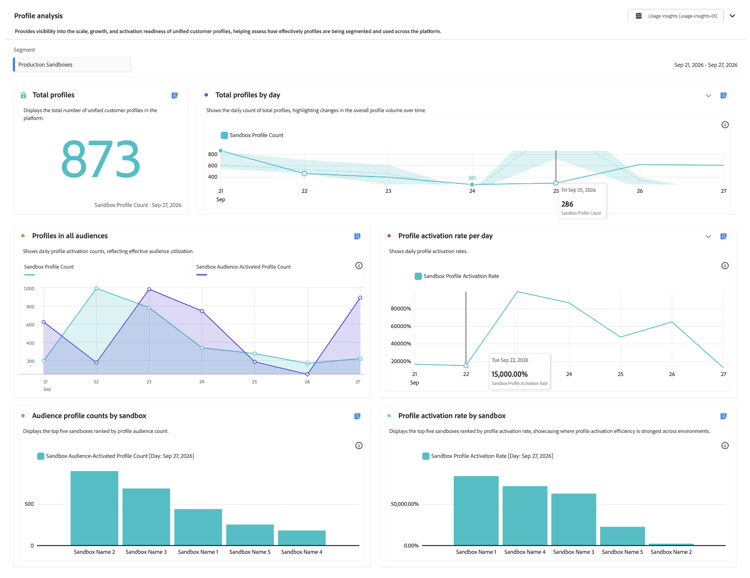
The Usage Insights Profile analysis section showing profile counts and activation metrics across the selected date range.

Chart
What it shows
Total profiles
The total number of unified customer profiles in the platform.
Total profiles by day
The daily count of total profiles, highlighting changes in overall profile volume over time.
Profiles in all audiences
Daily profile activation counts, showing total profiles alongside profiles in activated audiences.
Profile activation rate per day
Daily profile activation rates over the displayed date range.
Audience profile counts by sandbox
The top five sandboxes ranked by profile audience count.
Profile activation rate by sandbox
The top five sandboxes ranked by profile activation rate, showing where profile activation is strongest across environments.

Audience analysis audience-analysis

Audience analysis summarizes how audiences are created, activated, and evaluated across environments, highlighting audience adoption, effectiveness, and quality.
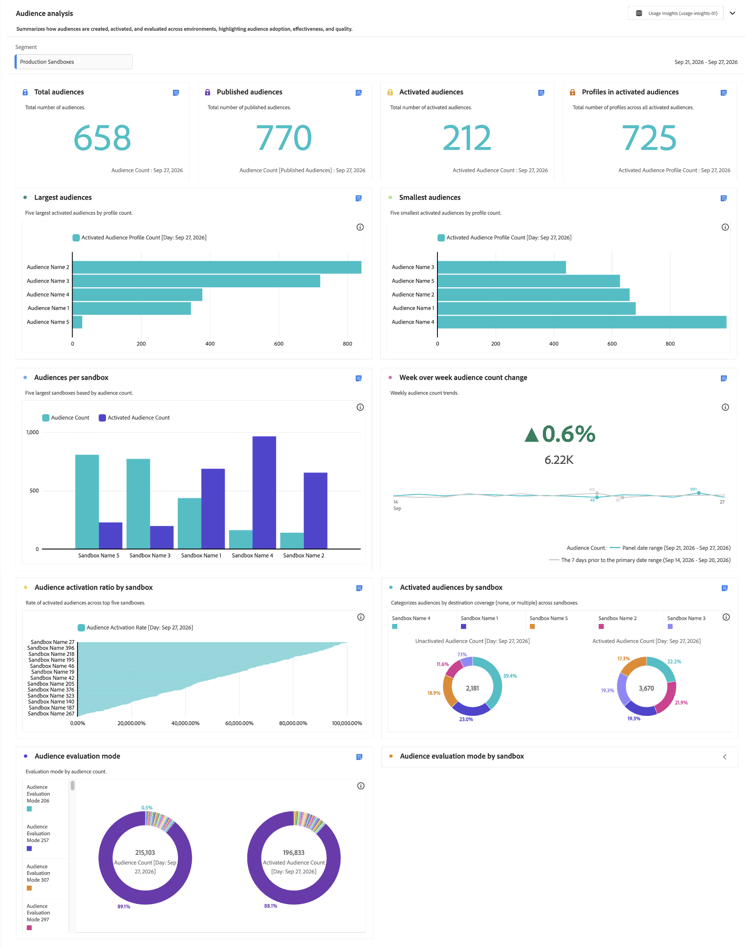
The Usage Insights Audience analysis section showing audience counts, activation metrics, audience counts by sandbox, and week-over-week audience change.

Chart
What it shows
Total audiences
The total number of audiences.
Published audiences
The total number of published audiences.
Activated audiences
The total number of activated audiences.
Profiles in activated audiences
The total number of profiles across all activated audiences.
Largest audiences
The five largest activated audiences by profile count.
Smallest audiences
The five smallest activated audiences by profile count.
Audiences per sandbox
The five largest sandboxes based on audience count.
Week over week audience count change
Weekly audience count trends compared with the previous seven-day period.
Audience activation ratio by sandbox
The rate of activated audiences across the top five sandboxes.
Activated audiences by sandbox
Audiences categorized by destination coverage across sandboxes.
Audience evaluation mode
Audience counts grouped by evaluation mode.
Audience evaluation mode by sandbox
Evaluation modes by audience count across sandboxes.

Destination analysis destination-analysis

Destination analysis shows how destinations are configured and used for activation, helping you understand the reach and maturity of audience delivery across sandboxes.
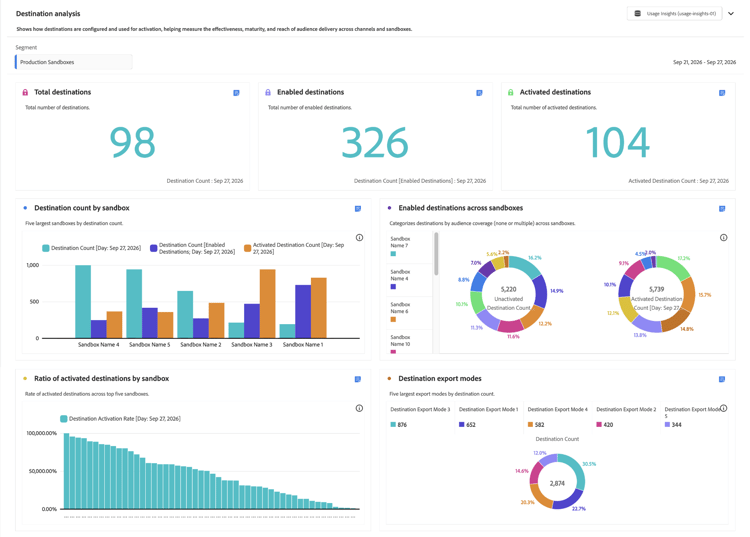
The Usage Insights Destination analysis section showing destination counts, activation, sandbox distribution, and export modes.

Chart
What it shows
Total destinations
The total number of destinations.
Enabled destinations
The total number of enabled destinations.
Activated destinations
The total number of activated destinations.
Destination count by sandbox
The five largest sandboxes by destination count.
Enabled destinations across sandboxes
Destinations categorized by audience coverage across sandboxes.
Ratio of activated destinations by sandbox
The rate of activated destinations across the top five sandboxes.
Destination export modes
The five largest export modes by destination count.

Channel analysis channel-analysis

Channel analysis provides an overview of outbound messaging activity across Adobe Journey Optimizer-managed channels, including delivery activity across email, SMS, in-app, push, and other supported channels.
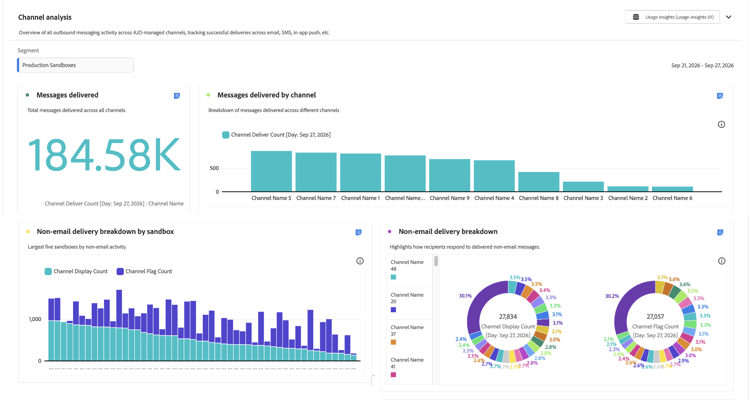
The Usage Insights Channel analysis section showing delivered-message metrics and email and non-email delivery breakdowns across channels and sandboxes.

Chart
What it shows
Messages delivered
The total number of messages delivered across all channels.
Messages delivered by channel
A breakdown of delivered messages across different channels.
Email delivery breakdown
How recipients respond to delivered email messages, including engagement actions and opt-outs.
Non-email delivery breakdown
How recipients respond to delivered non-email messages.
Email delivery breakdown by sandbox
The five largest sandboxes by email activity.
Non-email delivery breakdown by sandbox
The five largest sandboxes by non-email activity.

Campaign analysis campaign-analysis

Campaign analysis measures campaign activity and engagement.
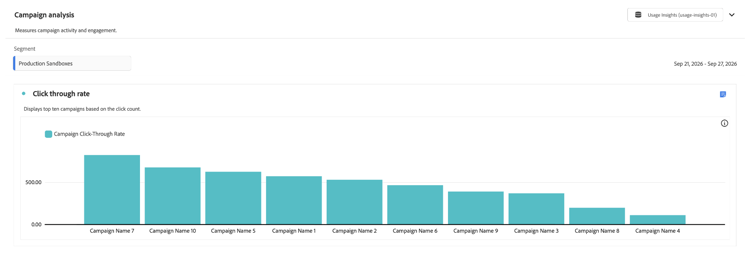
The Usage Insights Campaign analysis section showing the Click through rate chart for campaign engagement.

Chart
What it shows
Click through rate
The top ten campaigns based on click count.

Journey analysis journey-analysis

Journey analysis monitors how customers move through Adobe Journey Optimizer journeys, from entry to exit.
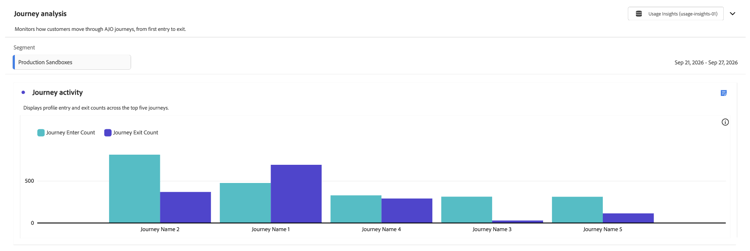
The Usage Insights Journey analysis section showing the Journey activity chart for profile entry and exit counts across journeys.

Chart
What it shows
Journey activity
Profile entry and exit counts across the top five journeys.

For analytics about how your organization uses Customer Journey Analytics, see the Customer Journey Analytics Product usage overview. Customer Journey Analytics Product usage is separate from the Usage Insights analysis areas described in this guide.

recommendation-more-help
experience-platform-help-run-and-operate