Enable debug logging for data collection
Diagnostic logging helps explain SDK commands, tag execution, warnings, and errors in the runtime where your implementation runs. Use it with request inspection when you also need to inspect requests or processing. If you are unsure where to start, see the Debugging and troubleshooting overview.
Choose a logging method choose-a-logging-method
debugEnabled, setDebug, the alloy_debug query parameter, or DebuggerdebugEnabled applies to every visitor who runs that configuration. setDebug and alloy_debug apply only to your browser tab, persist across same-origin page loads in that tab, and take precedence over debugEnabled. Explicitly disable them when finished._satellite.setDebug(true)_satellite.setDebug(false) or clear site data.debugEnabled or setDebugMobileCore.setLogLevelWeb SDK, tag-library, and Server SDK debug logging is disabled by default. Mobile SDK defaults to error-level logging rather than no logging.
Enable logging by library enable-logging
Expand the section for the library that your implementation uses. Each section explains how to enable logging, where to read the output, and how to turn logging off.
The following methods control Web SDK diagnostic output. They do not enable tag-library logging for a standalone Web SDK implementation.
debugEnabled in the configure command: Set debugEnabled to true in your existing configure call. This setting is useful in development environments. If deployed in your site’s code, it enables logging for visitors who run that configuration.
| code language-js |
|---|
|
Change the configuration value to false or omit it in subsequent deployments to restore the default. Do not run configure a second time on the same instance to toggle logging; use setDebug instead. A local debug override can take precedence over the configuration value. See debugEnabled for the configuration reference.
The setDebug command: Run the command against the appropriate Web SDK instance in your browser console:
| code language-js |
|---|
|
When finished, disable it:
| code language-js |
|---|
|
Running this command in your console changes your local instance, not other visitors’ browsers. If you put the same command in deployed site code, it affects visitors who execute that code. The local override can persist across page loads for that instance in the same-origin tab session when browser storage is available. See setDebug for more information.
The alloy_debug query string parameter: Add alloy_debug=true to the page URL, then load the page:
| code language-text |
|---|
|
Use &alloy_debug=true if the URL already has query parameters. This parameter enables logging locally without changing deployed code. Web SDK reads the parameter when each instance is created, so it applies to every Web SDK instance on the page. When browser storage is available, the setting persists for the tab’s same-origin session, so removing the parameter alone does not disable logging. Load the page with alloy_debug=false or run setDebug with enabled: false to disable it. If the URL still contains alloy_debug=true, reloading it enables logging again.
Adobe Experience Platform Debugger: Open Adobe Experience Platform Debugger, select the Web SDK section, and enable debugging in its configuration tab. Turn the option off when you finish.
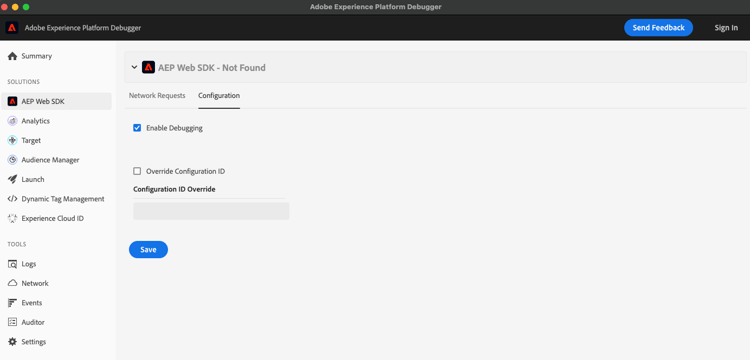
This procedure enables diagnostic output; using the Debugger for request or Edge inspection is covered in Inspect data collection requests.
On a page with a tag library, run the following in your browser console:
| code language-js |
|---|
|
This command exposes tag-library messages, including _satellite.logger output. For Web SDK instances managed by the Web SDK tag extension, the extension uses tag debug mode when configuring the SDK and forwards subsequent debug-mode changes to it. Do not assume that turning on debugging for a standalone or externally configured Web SDK instance also enables tag logging.
The Web SDK tag extension does not provide a debug toggle in its tags configuration UI. Use the console method for an extension-managed instance. Keep it out of tag rules.
To disable tag debug mode and the corresponding extension-managed SDK logging:
| code language-js |
|---|
|
Tag debug mode is stored in the browser’s local storage for the page’s origin. It persists across page loads and browser restarts until you disable it or clear the site’s data, and it does not enable logging for other visitors. See _satellite.setDebug() for scope and persistence details.
The tag library notifies the extension only when tag debug mode changes. If tag debug mode is already on but Web SDK messages are missing, a Web SDK override from setDebug or alloy_debug might have turned SDK logging off. Run _satellite.setDebug(false) and then _satellite.setDebug(true), or use the same Web SDK method that set the override.
The Server SDK writes diagnostic output to the server console, not the visitor’s browser.
Set debugEnabled: true in your existing server-side configure call to enable logging for the instance and the forRequest handles created from that configuration. The default is false. See debugEnabled for a complete configuration example.
For a targeted investigation, call setDebug on the request-scoped handle returned by forRequest. Logging changes only for that handle, so you can debug a single request without enabling it for all visitors:
| code language-js |
|---|
|
Calling setDebug on the top-level instance changes logging only for calls made directly on that instance, not for its request handles, until you disable it or the process restarts. To change the baseline for all request handles, update debugEnabled in the server’s configuration.
Messages identify the instance in square brackets, such as [alloy], and include configuration, method inputs/results, warnings, and errors. Review the server process’s output or the log destination to which your hosting environment routes it.
Use Mobile Core’s setLogLevel API to select diagnostic verbosity. Android defaults to LoggingMode.ERROR; iOS defaults to LogLevel.error. Set the desired level during app initialization before reproducing the issue.
Android: Enable verbose logging in your development app:
| code language-kotlin |
|---|
|
View output in Android Studio’s Logcat for the running app process. Mobile SDK messages use the AdobeExperienceSDK tag, so filter with tag:AdobeExperienceSDK and make sure the log viewer allows debug and verbose messages. Restore error-level logging when finished:
| code language-kotlin |
|---|
|
iOS: Enable trace logging in your development app:
| code language-swift |
|---|
|
View the running app’s console in Xcode and filter for AEP SDK. Restore error-level logging when finished:
| code language-swift |
|---|
|
Returning to error level reduces diagnostic output; it does not suppress errors. These calls change logging in the running app, not other installations. Ensure your initialization code does not re-enable verbose logging on the next launch or in a production build.
See the Mobile Core API reference for Java, Objective-C, supported levels, and version-specific details. For React Native or Flutter, use the API exposed by your Mobile SDK wrapper rather than copying native calls directly into wrapper code. For connected event inspection rather than runtime console output, see Assurance.
Read and troubleshoot diagnostic output read-output
Use the following identifiers to find SDK and tag messages in busy log output. If you renamed a Web SDK or Server SDK instance, look for that name instead of alloy.
[alloy], followed by a component name for component messages🚀 followed by the originating rule, extension, or data element name in brackets. See _satellite.logger.[alloy]AdobeExperienceSDKAEP SDK, followed by the log level and the extension label- Check the output location: Browser settings do not expose server or native-app logs. Select the correct browser page, server process, or app process.
- Check log levels: Web SDK messages use standard console levels that browsers show by default. Messages from
_satellite.logger.debug()require the console’s verbose level, and Mobile SDK debug and verbose messages require a log viewer that includes those levels. - Enable logging before the action: Existing messages are not recreated just because you turn logging on. Reproduce the issue after enabling it.
- Check the active control: Web SDK local overrides can supersede configuration. Tags and standalone SDK instances do not necessarily share a setting.
- Distinguish logs from transport evidence: A log can show that a command ran or a transport was selected without proving receipt. See Inspect data collection requests to inspect requests, responses, and supported processing views.
Web SDK monitoring hooks are a separate programmatic mechanism and run regardless of the debug-logging setting. Raw API clients, datastreams, and event forwarding do not share one universal SDK logging switch; use their application logs or service diagnostics as appropriate.