Observability via OpenTelemetry
Learn how AEM as a Cloud Service uses OpenTelemetry to send traces, metrics, and logs to the Application Performance Monitoring (APM) platform of your choice.
Adobe is replacing the built-in Application Performance Monitoring (APM) integration in AEM as a Cloud Service with OpenTelemetry, an open standard for collecting and exporting traces, metrics, and logs. With OpenTelemetry, you bring your own APM endpoint and monitor AEM alongside the rest of your applications, using the tools your teams already know. For more information, see the OpenTelemetry documentation.
This article explains what the integration provides, how telemetry flows from AEM to your APM platform, what you control, and what to consider before you enable it. The configuration tutorial explains how to set up OpenTelemetry for your AEM environment.
Why OpenTelemetry
With OpenTelemetry, you can:
- Choose your platform: Send telemetry to any backend that accepts OpenTelemetry Protocol over HTTPS (OTLP/HTTPS), including your current provider if it supports OTLP.
- See the full picture: Get traces, metrics, and logs through one integration, instead of separate mechanisms.
- Investigate faster: Find slow or failing requests, track JVM health over time, and correlate AEM behavior with your other services during an incident.
- Stay in control: Configure which destination to send data to, by using the Cloud Manager Config Pipeline and manage dashboards, alerts, and retention in your own platform.
Adobe provides and updates the OpenTelemetry Java agent that runs with AEM, so you do not install or upgrade it. You decide where the telemetry goes.
How it works
The following diagram shows the logical flow of telemetry from AEM services to your observability platform:
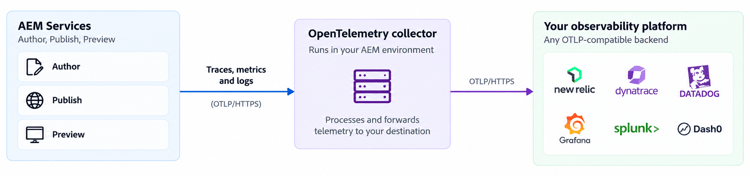
The OpenTelemetry Java agent collects application telemetry from AEM services and sends it to an OpenTelemetry Collector running within the AEM environment. The collector processes the telemetry and forwards it over OTLP/HTTPS to your configured observability platform.
Only telemetry generated by your AEM application is sent. Information about the underlying runtime and platform, such as internal hostnames, addresses, container identifiers, and operating system or process details, is removed before any data leaves your environment.
What telemetry is available
otel.yaml file using the Cloud Manager Config Pipeline, see configuration tutorialotel.yaml file with metrics: true using the Cloud Manager Config Pipeline, see configuration tutorialotel.yaml file with logs: true using the Cloud Manager Config Pipeline, see configuration tutorialA few details to keep in mind:
- To keep traces focused on application requests, high-volume internal activity such as health probes and scheduler (Quartz) jobs is filtered out.
- Fine-grained AEM framework-internal spans, such as Sling resource resolution, OSGi services, and JCR access, are not emitted in this release.
- Metrics use standard OpenTelemetry names, for example
jvm.memory.used,jvm.gc.duration,jvm.thread.count, andhttp.server.request.duration.
How AEM services are identified
Every trace, metric, and log entry carries resource attributes that let your platform tell environments and tiers apart:
-
service.nameidentifies the program, environment, tier, and environment type, following this pattern:code language-text cm-p<program>-e<environment>-aem-<author|publish|preview>-<environment-type>For example,
cm-p12345-e67890-aem-publish-prodis the Publish service of environment 67890 in program 12345, running in a production environment. -
deployment.environmentidentifies the environment type, such asprodorstage.
Use these attributes to filter and group telemetry, and to correlate logs with traces and metrics from the same service.
What you control
You configure the integration by deploying the config/otel.yaml file using the Cloud Manager Config Pipeline.
The sample configuration file is:
kind: "Otel"
version: "v1"
metadata:
  envTypes:
    - "dev"
    - "stage"
    - "prod"
data:
  enabled: true
  type: "generic"
  endpoint: "<YOUR_OTLP_HTTPS_ENDPOINT>"
  authHeaderName: "Authorization"
  authHeaderValue: "${{secrets.OTEL_CUSTOMER_AUTH}}"
  metrics: true
  logs: true
  advancedNetworking: false
The configuration determines:
- The environment types (
prod,stage,dev) it applies to - The destination type (
newrelic,dynatrace,generic, etc.) and OTLP/HTTPS endpoint - The authentication credential (
authHeaderNameandauthHeaderValue), referenced as a Cloud Manager secret environment variable namedOTEL_CUSTOMER_AUTH - Whether metrics (
metrics: true) and logs (logs: true) are exported in addition to traces - Whether Advanced Networking (
advancedNetworking: true) is used for the destination
The authentication credential (authHeaderValue) should be stored as a Cloud Manager secret environment variable named OTEL_CUSTOMER_AUTH, and referenced from the configuration file. Never store credentials as plain text in the repository.
If your OTLP/HTTPS endpoint is private, or requires outbound traffic from a known, stable IP address, enable Advanced Networking with dedicated egress. The advancedNetworking setting has no effect unless Cloud Manager has already provisioned Advanced Networking for the environment. A public SaaS endpoint uses the standard outbound network path.
Supported destinations
You can send telemetry to any APM platform that exposes an OTLP/HTTPS endpoint, including:
- New Relic
- Dynatrace
- Datadog
- Grafana Cloud
- Splunk Observability Cloud
- Dash0
- Honeycomb
- Elastic Observability
- Sumo Logic
- ServiceNow Cloud Observability
This list is not exhaustive. OpenTelemetry defines the telemetry format and export protocol and your selected platform determines how the data is queried, visualized, retained, and alerted on.
Choose an observability platform
You need a platform that accepts OTLP/HTTPS to receive the telemetry. Adobe does not provide it, you must bring your own observability platform.
If your organization already uses one of the platforms above, start there. If not, choose between a vendor-hosted (SaaS) platform and a self-hosted one:
Before you start
- Environments: You can enable OpenTelemetry individually on production, stage, and development environments. However, HIPAA-scoped environments, sandbox programs and Rapid Development Environments (RDEs) are NOT supported.
- Versions: The integration supports OpenTelemetry Java agent 2.x and the OTLP/HTTPS export protocol.
Next steps
Follow the configuration tutorial to set up OpenTelemetry with the AEM WKND sample project or your own AEM project.