CDN Performance dashboard cdn-performance
Understand how Cloud Manager evaluates content delivery network (CDN) performance and what you can learn from the dashboard.
Overview overview
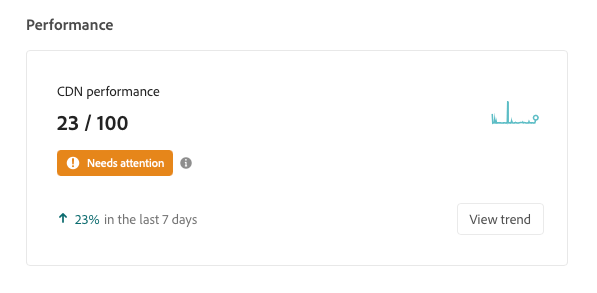
Every Cloud Manager program has a CDN performance dashboard. This dashboard presents an overall score for CDN performance along with trends, alerts, and suggestions for improvement as necessary.

Access the dashboard accessing
The CDN dashboard is available on the overview page of every program.
-
Log into Cloud Manager at my.cloudmanager.adobe.com and select the appropriate organization.
-
On the My Programs console, click the program whose CDN dashboard you want to view.

-
On the Program Overview page of your program, scroll down below the Environments and Pipelines cards to see the Performance card.

Use the dashboard using
The dashboard presents an overall score for CDN performance along with trends, alerts, and suggestions for improvement as necessary.

For details on your CDN performance and for suggestions on how to improve it, click View trend.

Click View below the chart to change the time span of the chart.
For suggestions on how to improve your CDN performance, select the Recommendations tab.

Click the chevron next to any recommendation in the list to view details about what steps to take to improve and the cause of the issue.
Cache hit definition cache-hit
The cache hit ratio is a measurement of how many content requests a cache can fill successfully, compared to how many requests it receives. The higher a cache-hit ratio, the better performing a CDN is.
Cache Hit Ratio = Cache Hits / (Hits + Misses + Passes + Other)
- Hit - Data is requested from the cache, and it is found.
- Miss - Data is requested from the cache, and it is not found.
- Pass - Data is requested from the cache, and it is set not to cache this data in any case.
- Other - All data requests from the cache that do not match any other case.
Cache metrics are updated every 24 hours.