Adobe Experience Manager produces a wealth of operational data, but in many projects, it's treated as something to check only after an incident. Access logs, error logs, request logs, dispatcher logs, query traversal warnings, and authoring activity all carry signals that reveal how your platform behaves. This article covers the best way to monitor these signals and optimize your performance.
What you'll learn in this article:
- Setting up your dashboard: configure AEMaaCS log forwarding to Splunk with reusable input controls for environment, instance type, and time range
- Request and error monitoring: track top errors, HTTP status codes, most-requested paths, and p95 response times with ready-to-use Search Processing Language (SPL) queries
- Editor activity monitoring: measure peak concurrency and hourly authoring trends to schedule deployments around real usage
- Index traversal detection: catch Oak queries silently scanning your Java Content Repository (JCR) before they become a production incident
- Practical recommendations: alert on patterns and trends, not individual events
Setting up your dashboard
Logs become much more valuable when aggregated, visualized, and monitored continuously. A single warning can be ignored, but the same warning repeated daily exposes a dangerous pattern. A single slow request can be ignored, but a growing cluster of slow requests on the same path signals a real problem. This article walks through building practical Splunk dashboards from AEM as a Cloud Service (AEMaaCS) logs, giving your team the visibility to move from reactive troubleshooting to proactive observability.
AEMaaCS logs can be forwarded from Cloud Manager to external destinations including Splunk. Once log forwarding is configured, creating a dashboard is straightforward: log in to Splunk, click Dashboards, and select Create New Dashboard. The drag-and-drop interface lets you add chart panels and bind each one to an SPL query.
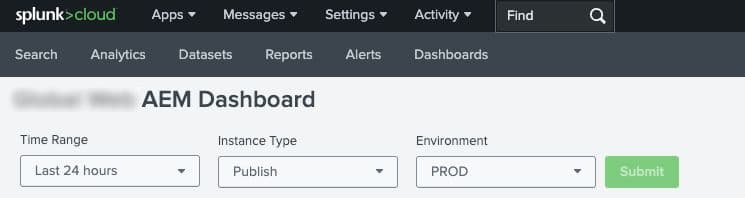
Start by adding three input controls to every dashboard: Time Range, Instance Type (author/publish), and Environment. These become dynamic tokens ($time_range$, $instance_type$, $environment$) referenced in every query below, letting a single dashboard serve all your AEMaaCS environments without duplication.
Request and error monitoring
The following four visualizations form the core of an AEM health dashboard. Together they answer the questions your team needs during both routine monitoring and incident investigation.
Top errors by occurrence
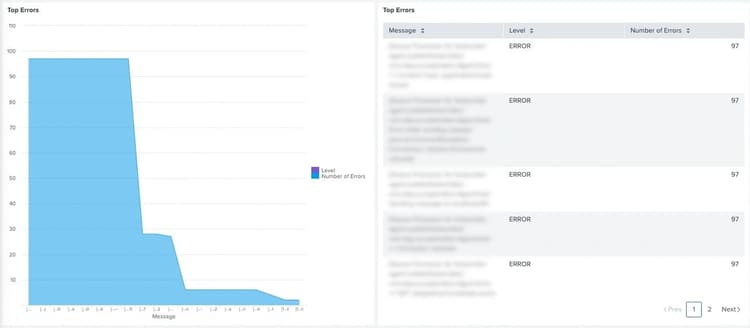
Prioritizing errors is the first step in any observability practice. This visualization surfaces the most frequently occurring error messages from the AEM error log, helping you focus remediation effort on the highest-impact issues rather than one-off noise.
index=<your_index> sourcetype=aemerror aem_tier=$instance_type$ aem_env_id=$environment$ level=ERROR | eval msg = substr(msg, 1, 500) | stats count by msg, level | sort -count | rename level AS "Level", msg AS "Message", count AS "Number of Errors" | head 20
HTTP status code distribution
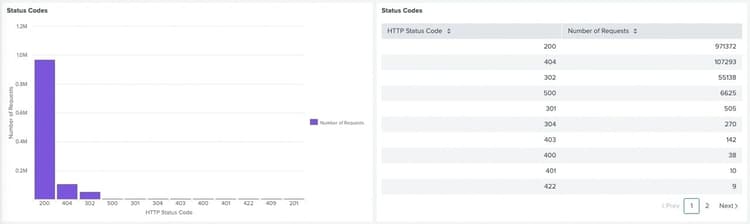
Monitoring response code volumes over time is one of the fastest ways to detect regressions. A sudden increase in 500s points to a backend failure; a spike in 404s can indicate a broken deployment or misconfigured redirect rules. Use this visualization to establish a baseline and alert on deviations.
index=<your_index> sourcetype=aemrequest aem_tier=$instance_type$ aem_env_id=$environment$ | stats count by code | sort -count | rename code AS "HTTP Status Code", count AS "Number of Requests"
Top requested paths
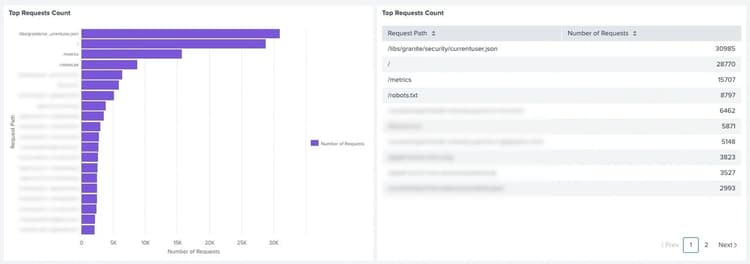
Knowing which paths receive the most traffic helps detect wrong client-side API implementations, cache configuration gaps, or unexpected crawlers. Path like /libs/granite/security/currentuser.json is expected here, as it is a user-specific client-side call. However, many requests to specific pages or assets can signal issues with your cache configuration.
index=<your_index> sourcetype=aemrequest aem_tier=$instance_type$ aem_env_id=$environment$ | stats count by path | sort -count | rename count AS "Number of Requests", path AS "Request Path" | head 20
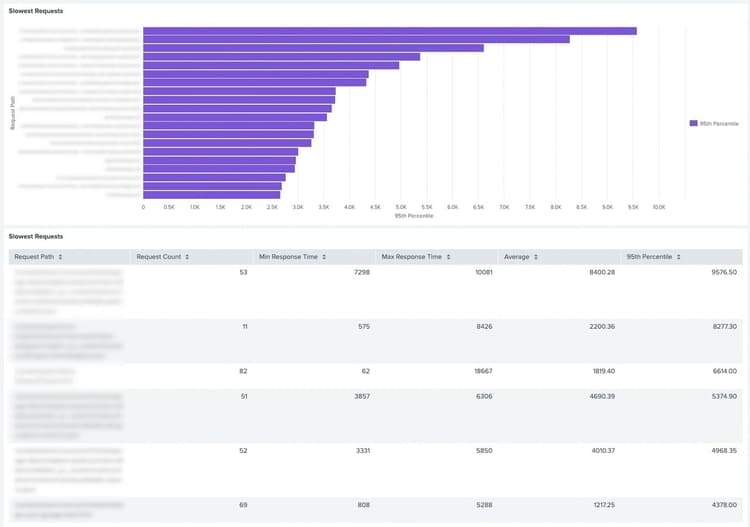
Average response times can mask severe outliers. Measuring the 95th percentile (p95) shows what a significant portion of real users experience. This query merges two events (request and response) from the AEM request log to capture both path and timing, then calculates min, max, average, and p95 response times per path.
index=<your_index> sourcetype=aemrequest aem_tier=$instance_type$ aem_env_id=$environment$ | eventstats first(path) as path, first(response_time) as response_time by request_id, pod_name | table request_id pod_name path, response_time | stats count as request_count, min(response_time) as min_response_time, max(response_time) as max_response_time, perc95(response_time) as p95_response_time, avg(response_time) as avg_response_time by path | eval request_count = request_count/2 | eval p95_response_time=round(p95_response_time,2) | eval avg_response_time=round(avg_response_time,2) | where request_count > 10 | sort -p95_response_time | rename path AS "Request Path", request_count AS "Request Count", min_response_time AS "Min", max_response_time AS "Max", avg_response_time AS "Average", p95_response_time AS "95th Percentile" | head 20
Editor activity monitoring
AEM Author is not only a technical system, it's the daily working environment for editors, content teams, and asset managers. Editor activity is an operational signal in its own right. Low authoring activity is a good window for maintenance, reindexing, or deployments. A surge of concurrent editors may add significant pressure to the Author tier. Without visibility into this, teams make scheduling decisions based on assumptions.
The most useful starting point is understanding how many editors are active and when activity peaks. The queries below track total unique editors, peak concurrency in 5-minute windows, and hourly activity trends.
/* Total unique editors */ index=<your_index> aem_env_id=<your_env> sourcetype=aemaccess aem_tier=author (method=GET OR method=POST) | where user!="" AND user!="anonymous" AND user!="admin" AND user!="-" AND NOT like(user,"oauth%") | stats dc(user) AS total_unique_editors /* Peak concurrent editors (5-min windows) */ ... same filter ... | timechart span=5m dc(user) AS active_editors | stats max(active_editors) AS peak_active_editors /* Unique active editors per hour */ ... same filter ... | timechart span=1h dc(user) AS active_editors
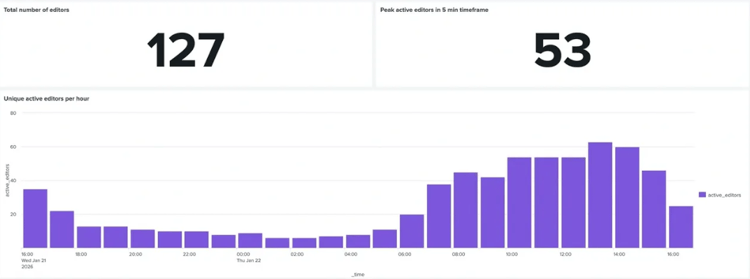
This view is especially valuable in enterprise environments where multiple teams share the same Author instance. Campaign preparation, asset uploads, and pre-deadline page edits can all converge on the same Author tier simultaneously. Visualizing activity patterns lets teams understand when the platform is under pressure, and schedule sensitive operations accordingly.
Index traversal: the hidden performance signal
Some AEM performance problems are obvious. Others are silent until they're not. Index traversal is the clearest example of the latter.
Traversal occurs when an Oak query cannot use an index and instead scans large portions of the JCR. It often goes unnoticed during development, because content volumes are low and the query returns results correctly. As content grows and traffic increases, traversal warnings multiply, CPU usage climbs, and authors begin experiencing slowdowns; sometimes months after the problematic query was deployed.
The warning is already in the logs, but it's easy to miss in manual review. In Splunk, the same warning can become a dashboard that shows which queries are traversing, how many nodes they're scanning, and whether the count is growing after each deployment. That's the difference between debugging a known incident and detecting a forming one.
index=<your_index> aem_env_id=<your_env> sourcetype=aemerror aem_tier=author level=WARN "Index-Traversed" | rex field=msg "Index-Traversed\s(?<nodes_traversed>\d+)\snodes" | eval nodes_traversed=tonumber(nodes_traversed) | rex field=msg "(?i)isdescendantnode\s*\(\s*(?:[^,]+,\s*)?['\"](?<search_path>/[^'\")]+)['\"]" | eval search_path=coalesce(search_path, "/unknown") | rex field=msg "Filter\(query=(?<query_part>.*?)(?:/\*|$)" | eval query_part=coalesce(query_part, "unknown-query") | eval query_part_short=if(len(query_part)>300, substr(query_part,1,300)."...", query_part) | stats count as occurrences, min(nodes_traversed) as min_nodes, avg(nodes_traversed) as avg_nodes, max(nodes_traversed) as max_nodes, p95(nodes_traversed) as p95_nodes by search_path query_part_short | eval avg_nodes=round(avg_nodes,0), p95_nodes=round(p95_nodes,0) | sort -occurrences -max_nodes | head 10 | fields query_part_short occurrences
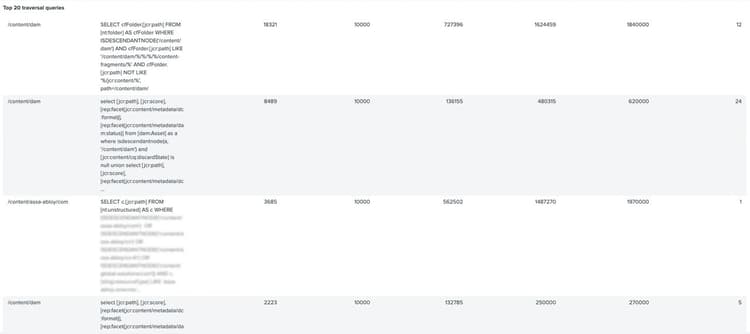
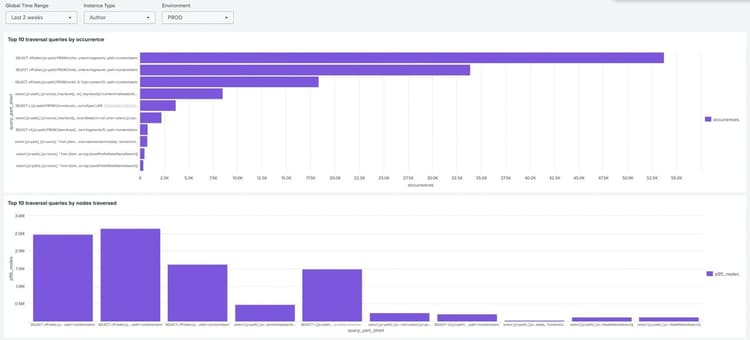
Traversal monitoring should be part of every AEM platform health dashboard, not an optional extra. If a query is inefficient today and content volumes are growing, it will create performance incident eventually. Detecting it early gives your team time to optimize the query, extend the correct Oak index, and validate the fix before authors feel the impact.
Practical recommendations
The shift this article describes is conceptually simple: stop treating logs as an incident archive and start treating them as a continuous operational feed. A few principles make that shift practical:
-
Build dashboards around decisions, not data. A chart that doesn't inform a specific action will quickly be ignored. Each visualization should answer a question your team actually asks: Which errors are highest priority? Which paths require cache optimization? Is this deployment better or worse than the last?
-
Alert on patterns, not individual events. A single traversal warning is investigable; 50 traversal warnings from the same query after every deployment is a regression. Set alerts on thresholds and trends, not raw event counts.
-
Watch warnings as carefully as errors. Warnings are the early signal. Teams that monitor only ERROR-level events miss the traversal and deprecation warnings that precede larger failures.
-
Track trends over snapshots. Absolute values matter less than direction. A growing p95 response time on a key path, even if still within acceptable bounds, deserves attention.
-
Let observability drive action. Dashboards are inputs to decisions that lead to better and more performant code. Review them on a cadence and close the loop with fixes.
Conclusion
AEM performance issues are rarely sudden. The platform almost always provides early signals like rising error rates, repeated traversal warnings, or growing response times before an issue becomes visible to authors or end users. Those signals are already in your logs.
Splunk gives your team the tools to make those signals visible, queryable, and actionable. The queries and dashboard patterns in this article are a good starting point. Adapt them to your environment, extend them as your platform matures, and use them to move from reactive firefighting to deliberate, evidence-based platform management.