[Beta]{class="badge informative"}
Sample Size Calculator
The Sample Size Calculator allows you to estimate the inputs needed to plan an experiment before you launch it. The calculator helps you determine how much traffic you need, how long the test should run, how many experiences to include, or what minimum effect you can reliably detect based on the values you provide.
To access the Sample Size Calculator, go to the Activities menu.
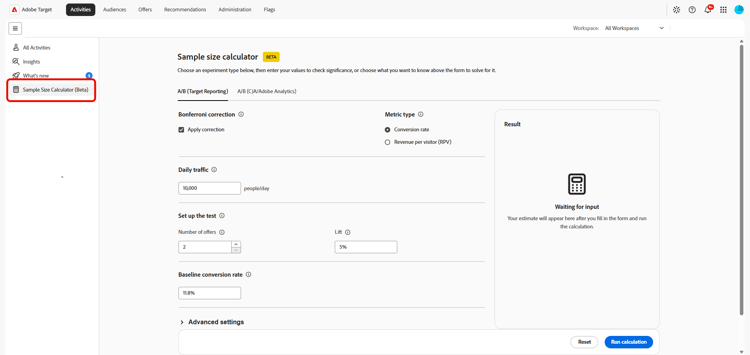
A/B (Target reporting)
Estimate the inputs required to plan and run an A/B test. These values help you decide how much traffic you need, how long the test should run, and what effect size you can realistically detect.
-
Access the A/B (Target Reporting) tab to calculate planning inputs for an A/B test.
-
Enable the Apply correction option to adjust your confidence level to account for comparing more than one offer against the control at the same time.
-
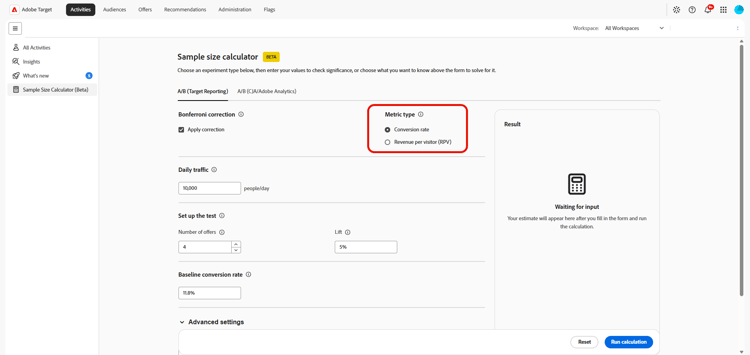
Choose your Metric type:
-
Conversion rate: use this for binary outcomes like clicks or purchases, where each visitor either does or does not complete the action.
-
Revenue per visitor: use this for revenue-style metrics, where values can vary widely from visitor to visitor.
-
-
Specify the Daily traffic, the number of users entering the experiment each day.
-
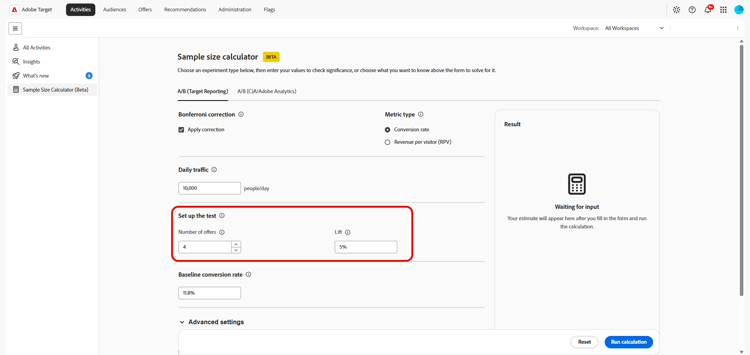
Under Set up the test, enter the remaining values:
-
Number of offers: The number of experiences in your experiment, including the control. More than two offers applies a Bonferroni correction, when enabled, to maintain the overall confidence level.
-
Lift: The relative improvement over baseline that you want to detect. Enter it as a percentage of the baseline, for example, a 5% lift on an 11.8% baseline conversion rate targets 12.39%.
-
-
Specify the Baseline conversion rate for your current experience before the experiment starts.
-
You can expand Advanced statistical settings to provide additional statistical inputs when they are available for the selected calculation.
-
Confidence level: The likelihood that a result is not due to chance. A 95% level allows a 5% chance of a false positive.
-
Statistical power: The likelihood of detecting a real effect. An 80% power reduces false negatives but requires more traffic or time.
-
-
Select Run calculation to generate the estimate. Select Reset to clear the current inputs and start again.
The Result panel displays the estimate after you complete the required fields and run the calculation. If required fields are incomplete, the panel prompts you to enter the missing values.
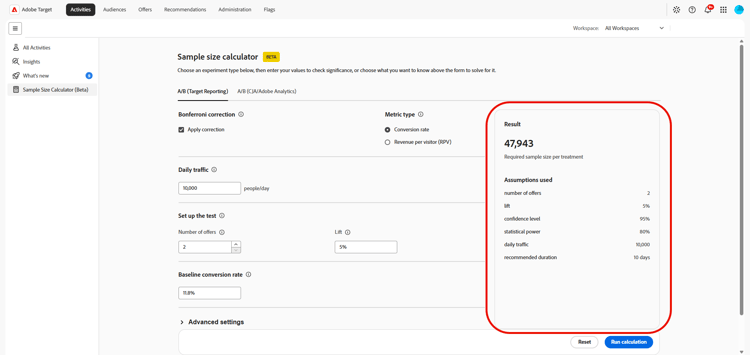
The calculator provides an estimate for planning an experiment. Use the result together with your experiment design, expected traffic, baseline performance, and statistical requirements when deciding how long to run the activity.
A/B (CJA/Adobe Analytics)
Estimate the planning inputs for an A/B activity that relies on Adobe Analytics or Customer Journey Analytics data. It helps you define the experiment size, expected lift, and test duration before you launch the activity.
-
Access the A/B (CJA/Adobe Analytics) tab to calculate planning inputs for an A/B test.
-
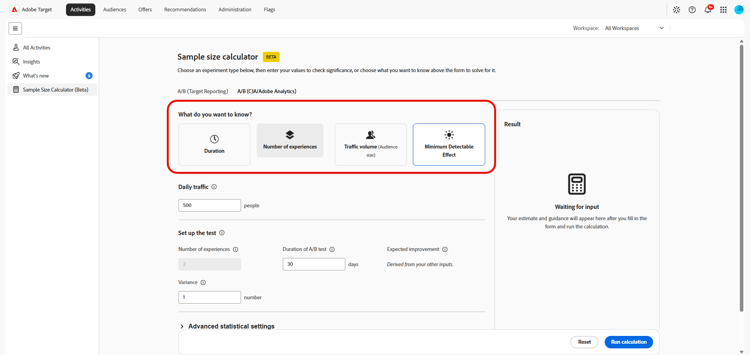
Under What do you want to know?, select the value you want the calculator to determine:
- Duration: You have an experiment in mind and want to know how long it would take to run and whether it is worth running.
- Number of experiences: You have a location to run an experiment and want to figure out how many treatments your traffic could support.
- Traffic volume: You have an experiment in mind and want to know how many visitors you need to reach statistical significance.
- Minimum Detectable Effect: You have an experiment you want to run but want to know how much of a lift you need to reach statistical significance. This helps you assess whether the experiment is worth running or planning.
The fields in the form change depending on the value you select. The calculator uses the other inputs to determine the selected result.
-
Specify the Daily traffic, the number of users entering the experiment each day.
-
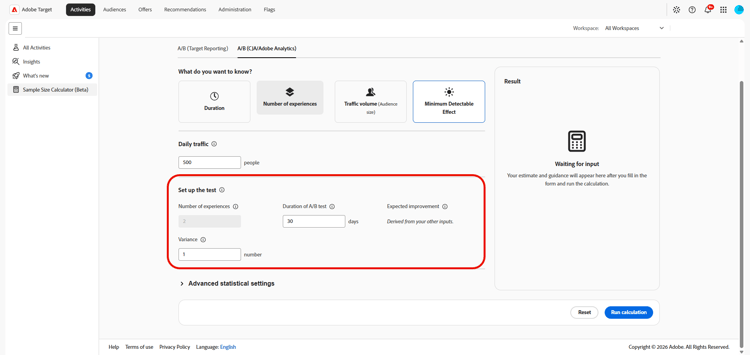
Under Set up the test, enter the remaining values:
-
Number of experiences: The number of variants, including the control. More variants require more traffic.
-
Duration of A/B test: The number of days the experiment runs. Longer tests can detect smaller effects.
-
Expected improvement: The improvement you expect the experiment to produce.
-
Variance: How spread out your metric values are. A click-through rate typically has low variance, revenue per user can be much higher. If you are unsure, leave the default value at 1.
Learn how to calculate a Variance in Analytics documentation
-
-
You can expand Advanced statistical settings to provide additional statistical inputs when they are available for the selected calculation.
-
Confidence level: The likelihood that a result is not due to chance. A 95% level allows a 5% chance of a false positive. Lower confidence levels mean less traffic is needed, but they also increase the risk of a false positive.
-
Statistical power: The likelihood of detecting a real effect. An 80% power reduces false negatives but requires more traffic or time.
-
-
Select Run calculation to generate the estimate. Select Reset to clear the current inputs and start again.
The Result panel displays the estimate after you complete the required fields and run the calculation. If required fields are incomplete, the panel prompts you to enter the missing values.
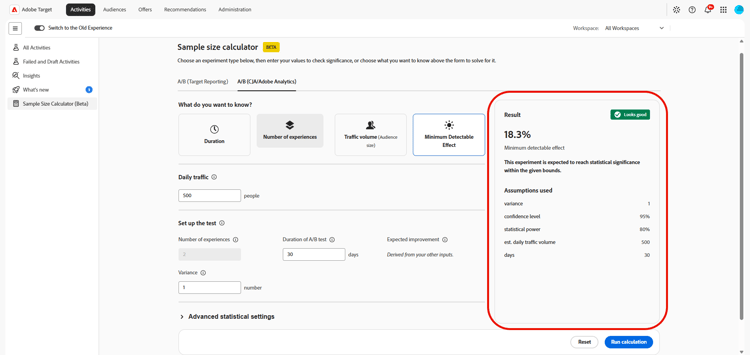
The calculator provides an estimate for planning an experiment. Use the result together with your experiment design, expected traffic, baseline performance, and statistical requirements when deciding how long to run the activity.