Track engagement by user group in Report Builder
This report helps training managers and L&D administrators identify which user groups are most active and how engagement trends month on month. It uses the Active Field User Group and Enrollment data sets with group by and aggregate functions to produce one summary row per user group per month.
Build the engagement by user group report
-
Launch Report Builder and select Create Report.
-
Select Create report. Type a name, for example, Engagement by user group MoM.
-
In the Select columns panel, expand Active Field User Group and select + next to User Group Name. The column appears in the Selected Columns panel.
-
Expand Enrollment and select + next to Enrolled Date.
-
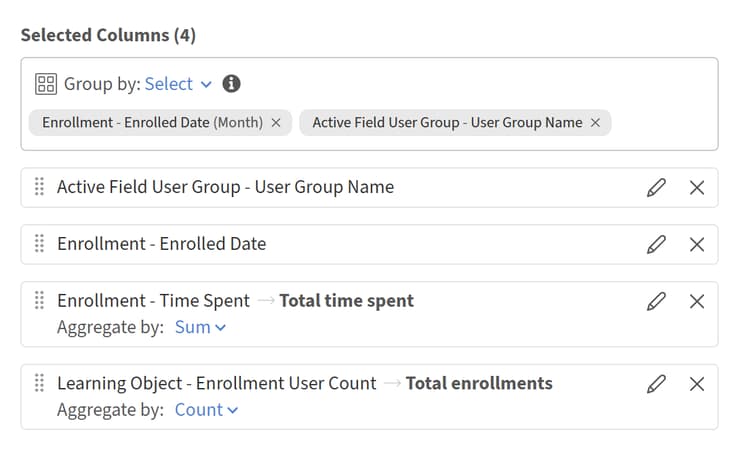
Select + next to Time Spent. Select the edit (pencil) icon and enter the alias Total time spent.
-
Expand Learning Object and select + next to Enrollment User Count. Select the edit icon and enter the alias Total enrollments.
-
Select Group by: Select at the top of the Selected Columns panel.
-
Choose Enrollment - Enrolled Date and set the granularity to Month. Choose Active Field User Group - User Group Name. Both appear as tags: Enrollment - Enrolled Date (Month) and Active Field User Group - User Group Name.
-
On the Enrollment - Time Spent row, select Aggregate by and choose Sum.
-
On the Learning Object - Enrollment User Count row, select Aggregate by and choose Count.
-
Select Add filter. Choose Enrollment - Enrolled Date, select a relative range such as Last 3 months, or enter a specific date range.
-
Select + Add sorting. Sort by Enrollment - Enrolled Date ascending, then add a secondary sort on Total time spent descending.
-
Select Save Report and select Actions > Download to download the report.
The report will have one row per user group per month, showing total time spent and total enrollments for that period.