Visualizations in Report Builder
Visualizations in Adobe Learning Manager Report Builder turn a saved report into charts and dashboards. You can compare groups, spot trends, and share results without reshaping data in a spreadsheet tool.
About visualizations in Report Builder about-visualizations
A visualization is a chart, or a dashboard of charts, built from a report you saved in Report Builder. You choose which report columns to plot, and Report Builder draws the chart from the report data. You can plot columns directly, or plot summarized data from a report.
- Build charts for a report: Open the report, select Visualization, and create charts. See Create a chart from a report.
- Group charts on a dashboard: Choose reports as a data source, and then add charts from them. See Build a dashboard.
- Share and view: Share a dashboard with Administrators, who view and filter it in read-only mode.
Charts work in two modes:
- Configure mode: You create or edit the chart.
- View mode: You filter what the chart displays without changing how it is built.
Chart types and when to use them chart-types
Choose the chart type by the question you want to answer.
Visualization terms visualization-terms
Create a chart from a report create-chart-from-report
Create a chart from a saved report to see enrollment, completion, or time-spent data at a glance. You configure the chart once, and it draws from your report data each time you open it.
Before you create a chart before-you-create-chart
Confirm the following:
- Save the report. The option to add a chart appears on the Report Builder page after you save the report.
- Use your own report. Duplicate a shared report to create your own copy, and then use it to create charts.
- Check the size. A report with more than 10 million rows can’t be plotted. A summarized report with more than 10,000 data points isn’t plotted. See Chart and dashboard limits.
- Know your columns. The chart’s X axis (dimension) and Y axis (measure) come from your report’s columns. To summarize the report itself, use Group by and aggregates. For more information, see Apply group by and aggregations.
Configure a chart configure-chart
-
Sign in to Adobe Learning Manager as an Administrator.
-
Select Reports, and then select Report Builder.
-
Select the Reports tab, and then open a saved report. For this example, select a user login trend report, which shows the number of users who logged in to the learning platform on each date.
-
In the left navigation, select Visualization. A panel opens with Setup and Style tabs.

note NOTE After a chart exists, select Edit, and then select + to add another chart. -
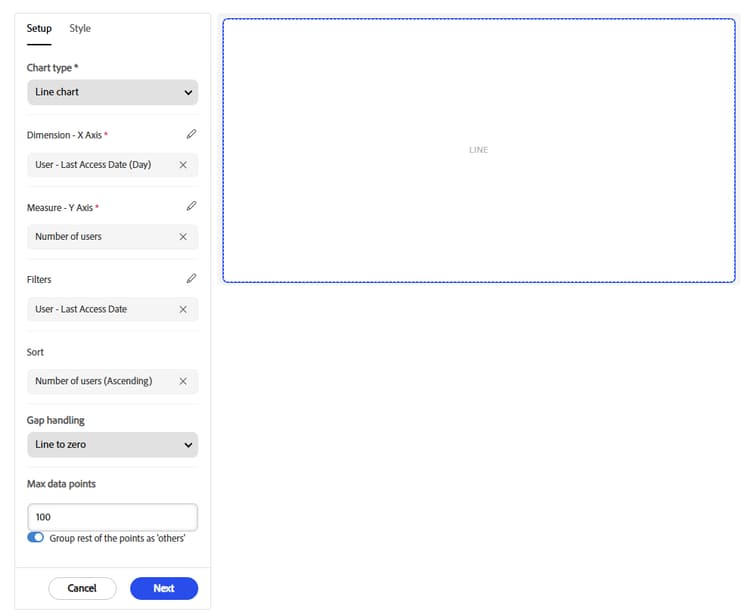
In Chart type, select a type, such as Line chart. This field is required.
-
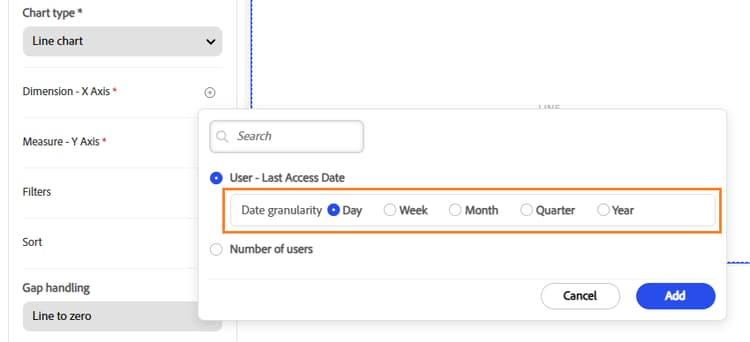
Next to Dimension - X Axis, select the add icon, and then select the report column. For a date column, also select a Date granularity, such as day or month.
-
Select Add to add the date dimension.
-
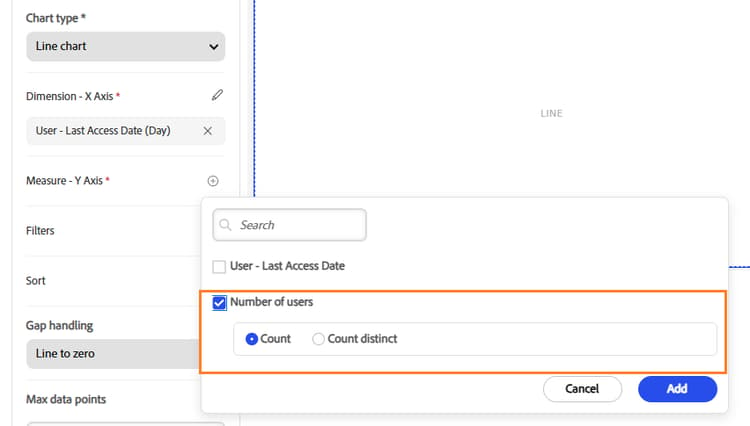
Next to Measure - Y Axis, select the add icon, and then select the report column and how to aggregate it, such as Count.
-
Select Add to add the measure.
-
(Optional) Select Add filter to limit the plotted data to a range, such as the last 30 days. Select Add.

-
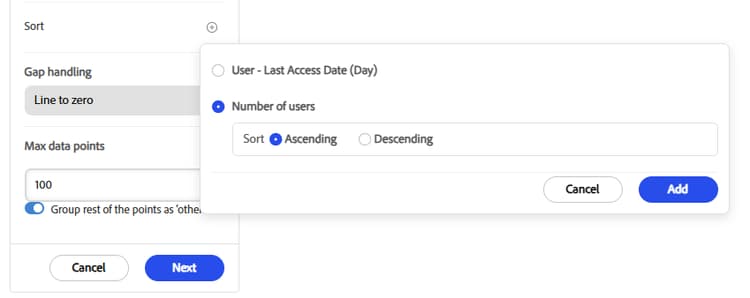
(Optional) Add a Sort column, and then select Ascending or Descending. Select Add.
-
(Optional) For a line chart, set Gap handling for missing data. See Gap handling for missing data.
-
In Max data points, enter the number of data points to plot on the chart. The default is 100 points, and the limit is 10,000.
-
Turn on Group rest of the points as ‘others’. Report Builder displays individual data points up to the Max data points value, and combines everything beyond that limit into one additional category called Others.
For example, if Max data points is 150 and your query returns 200 points:
- Report Builder displays 150 points individually.
- Report Builder combines the remaining 50 points into Others.
- The chart shows 151 plotted points: 150 plus Others.
-
Select Next. You can now customize your chart.
Gap handling for missing data gap-handling
Gap handling defines what the chart does when one or more observations in a series have no numeric value, such as NULL, NA, NaN, or an empty cell.
Suppose the data is:
The following table shows the three behaviors.
10 -> 15 -> 0 -> 0 -> 2510 -> 15 2510 -> 15 ----> 25Customize the chart customize-chart
Customize a chart to make it clear and easy to read. On the Style tab, you can add a title, show or hide axis titles and legends, position and align the legend, and set a color for each series. Style changes affect only how the chart looks. They don’t change the data it plots.
-
To show a title above the chart, select Show title for chart. To hide it, turn the option off.
-
In Chart title, enter a title for the chart.
-
Select Show title for X Axis and Show title for Y Axis to label the axes.
-
To show a key that identifies each line, select Show legends.
-
In Legend position, select the left, center, or right icon to align the legend.
-
Under Line color, select the color swatch next to a series, such as Number of users.
-
In the color picker, choose a color from the palette, or use the custom tab to define your own.
-
Repeat the previous two steps for each line you want to recolor.
-
Select Create to add the chart. If you’re editing an existing chart, select Save.
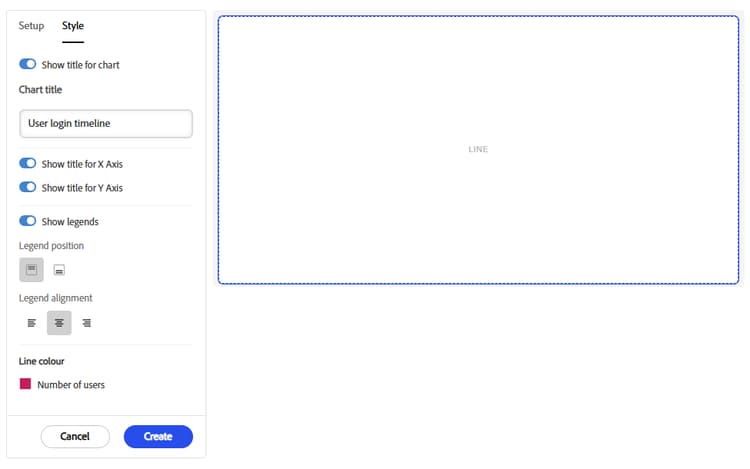
The chart appears with your titles, legend, and line colors.
- Choose colors that contrast clearly with each other and with the background. Keep titles and the legend on so that color isn’t the only way to tell the lines apart.
- The Legend position, Legend alignment, and Line color options apply only when Show legends is turned on.
- Each line in the chart has its own swatch, one per measure you added on the Setup tab.
To arrange charts on a single page, see Build a dashboard.
Create a pie chart create-pie-chart
Use a pie chart to show how a whole divides into parts, such as the share of employees who completed mandatory training, or the mix of course formats. Each slice shows one category’s share of the total.
About pie charts about-pie-charts
A pie chart draws one slice per category. The slice size shows that category’s share of the total measure. A legend identifies each slice, and each slice displays its value.
Use a pie chart to show parts of a whole across a few categories, when viewers need proportion more than exact values. To compare many categories, use a bar chart. To show change over time, use a line chart.
Steps to create a pie chart pie-chart-steps
Before you begin, save a report that you own. Include one column for the categories and one column to measure.
- Select Reports, and then select Report Builder. On the Reports tab, open the saved report.
- In the left navigation, select Visualization.
- In Chart type, select Pie chart.
- Next to Dimension - Segment, select the add icon, and then select the column that defines the slices. For example, select Transcript (Learning Object) - Status.
- Next to Measure - Value, select the add icon, and then select the column and aggregate that size the slices, such as Count.
- (Optional) In Max data points, enter the maximum number of slices to draw. The default is 100.
- (Optional) To combine minor categories, turn on Group rest of the points as ‘others’.
- Select Next to customize the pie chart.
Customize the pie chart customize-pie-chart
-
To show a title, turn on Show title for chart. Turn it off to hide the title.
-
In Chart title, enter a title, such as
Mandatory Compliance Completion. -
In Chart style, select Pie for a solid circle, or Donut for a ring.
-
Select Show legends to display the legend on the chart.
-
In Legend position, select where the legend appears.
-
In Legend alignment, select left, center, or right.
-
Select Create for a new chart. When you edit an existing chart, select Save, and then select Save on the Visualization page.

Report Builder creates the pie or donut chart.
Create a bar chart create-bar-chart
Use a bar chart to compare a measure across categories, such as training status by team or learning time by customer. Bars are easy to compare and rank, and you can group or stack them to add a second breakdown.
About bar charts about-bar-charts
A bar chart draws one bar for each category on the X axis. The bar’s length shows the measure on the Y axis, such as a count of learners. You can draw bars vertically (columns) or horizontally.
Use a bar chart to:
- Compare values across categories, such as teams, partners, or customers.
- Rank categories from highest to lowest.
- Show a second breakdown inside each bar, such as status within each partner.
Before you create a bar chart before-you-create-bar-chart
- Save the report, and use a report you own.
- Include a column for the categories and a column to measure.
- Keep the report within the limits in Chart and dashboard limits.
Steps to create a bar chart bar-chart-steps
-
Select Reports, and then select Report Builder. On the Reports tab, open the saved report.
-
In the left navigation, select Visualization.
-
In Chart type, select Bar chart.
-
Next to Dimension - X Axis, select the add icon, and then select the column that defines the categories. Select Done.

-
Next to Measure - Y Axis, select the add icon, and then select the column and how to aggregate it, such as Count. Select Done.

-
(Optional) Add Filters to limit the data, and set Sort to order the bars by a column.
-
In Max data points, enter the maximum number of data points to plot. If you enter 150, Report Builder displays up to 150 individual data points, and combines everything beyond that limit into one additional category called Others.
-
Select Next to customize the bar chart.
Customize the bar chart customize-bar-chart
Use the Style tab to set the title, orientation, grouping, legend, and colors. Style settings change how the chart looks, not the data it plots.
- Select the Style tab.
- To show a title, turn on Show title for chart. In Chart title, enter a title, such as
Most Popular Courses. - To label the axes, turn on Show title for X Axis and Show title for Y Axis. Turn an option off to hide that title.
- In Chart style, select Vertical for columns, or Horizontal for bars that run sideways. Horizontal bars leave more room for long category names.
- In Bar grouping, select one of the three icons to set how multiple series share a category: grouped, stacked, or 100% stacked.
- To identify each series, turn on Show legends.
- In Legend position, select where the legend appears. In Legend alignment, select left, center, or right.
- Under Bar color, select the swatch next to a series, and then choose a color.
- Select Create for a new chart. When you edit an existing chart, select Save.
Create a big number create-big-number
Use a big number to show one key metric as a large, easy-to-read figure, such as total learners, overdue enrollments, or active users. Big numbers work well at the top of a dashboard, where viewers check key figures first.
About big numbers about-big-numbers
A big number is a tile with two parts: a value and a label. The value is a single number calculated from your report, such as a count or a sum. The label tells viewers what the number means. A big number has no axes, legend, or categories.
Use a big number to:
- Show a headline figure that someone checks regularly.
- Give context to a dashboard before the detailed charts below it.
Steps to create a big number big-number-steps
Before you begin, save a report you own. Decide the one number you want, and which column and aggregate produce it.
For example, training Administrators report each month on how much training the organization completed. Leaders want one headline figure, not a list of enrollments, and Administrators want to refresh it without rebuilding the report.
-
Select Reports, and then select Report Builder. On the Reports tab, open the saved report.
-
In the left navigation, select Visualization.
-
In Chart type, select Big Number.
-
In Measure - Value, select Transcript (Learning Object) - Status, and then apply the Count aggregate. Select Done.

-
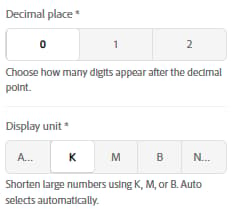
Select the number of digits to show after the decimal point. You can select at most two digits.
-
In Display unit, select how large numbers are shortened. Select K for thousands, M for millions, B for billions, or None to show the full value. Auto selects the appropriate unit automatically. Select Next.
Customize the big number customize-big-number
Use the Style tab to customize the legend properties of the big number.
-
In Legend title, enter the text that names the number. For example, enter
Total Course Completions. -
In Legend position, select one of the two icons to set where the title appears.
-
In Legend alignment, select left, center, or right.
-
Select Create for a new chart. When you edit an existing chart, select Save.

Create a table or pivot chart create-table-pivot-chart
Use a pivot table to summarize a number across two categories, such as how many learners in each manager’s team have completed, started, or not started required learning. You can also switch to a pivot-style view, where dates or categories run across the top of the table, so each learner or course fits on one row.
About table and pivot charts about-table-pivot
A pivot table is a grid with one category down the side, one category across the top, and a number in each cell. Each cell shows the measure for one row value and one column value. You build it with three settings on the Setup tab.
A dimension is a field you group by. A measure is a number you calculate.
Before you create a table chart before-you-create-table-chart
- To use column-to-row view, group the report by the column you want as headings, such as a date.
- If you group by more than one date column, you pick one of them for the headings.
Steps to create a table chart table-chart-steps
-
Select Reports, and then select Report Builder. On the Reports tab, open the saved report.
-
In the left navigation, select Visualization.
-
In Chart type, select Table / Pivot.
-
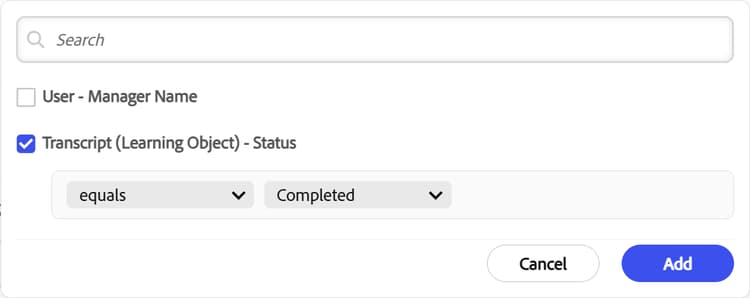
Next to Dimension - Rows, select the add icon, and then select User - Manager Name.
-
Next to Dimension - Columns, select the add icon, and then select Transcript (Learning Object) - Status.
-
Next to Measure - Value, select the add icon. Select the measure Transcript (Learning Object) - Status, and then select Add.
-
Turn on either or both of the following options, based on your reporting requirements:
- Show grand total for columns: Displays the grand total for each column. For example, if the table displays sales data across different regions, the grand total shows the total sales for each column.
- Show grand total for rows: Displays the grand total for each row. For example, if the table displays monthly sales across different products, the grand total shows the total sales for each row.
-
In Number of rows to be displayed (max 20), enter how many rows to show in the table at one time. The default is 10, and the maximum is 20. For example, 15 displays 15 rows per page.
-
Select Next.
Customize the table customize-table
Use the Style tab to add the chart title, color the table header, and color the table rows.
- In Chart title, enter the title you want to display, such as
Status of Learning. - Select Header row color to apply a background color to the header row.
- Turn on Highlight alternate rows to apply alternating colors to rows for easier reading.
- Select Color 1, and choose the first color for the alternating rows.
- Select Color 2, and choose the second color for the alternating rows.
- Select Save to apply the style settings to the chart.
Build a dashboard build-dashboard
A dashboard puts charts from one or more of your reports on a single page. Build one when you answer the same questions repeatedly, such as how many people completed training this month, or which teams are behind.
About Report Builder dashboards about-dashboards
A dashboard is a page of charts. You choose the reports it draws from, called its data source, and then add charts from those reports. Charts always come from reports, so create them first on each report’s Visualization page. You can use only reports you own. Scoping applies to every chart on the dashboard.
Create the dashboard create-dashboard
-
Select Reports > Dashboards. The page lists all dashboards that you created.
-
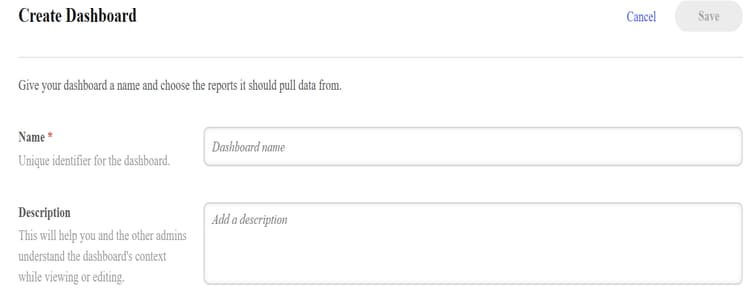
Select Create Dashboard.
-
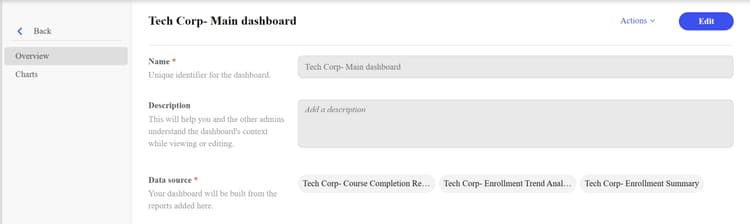
Enter the name and description of the dashboard.
-
In Data source, select Add report to add the pre-created charts from the available reports.
-
Select one or more reports from the list, and then select Add.

Report Builder adds the reports to the dashboard.
View the charts in the dashboard view-charts
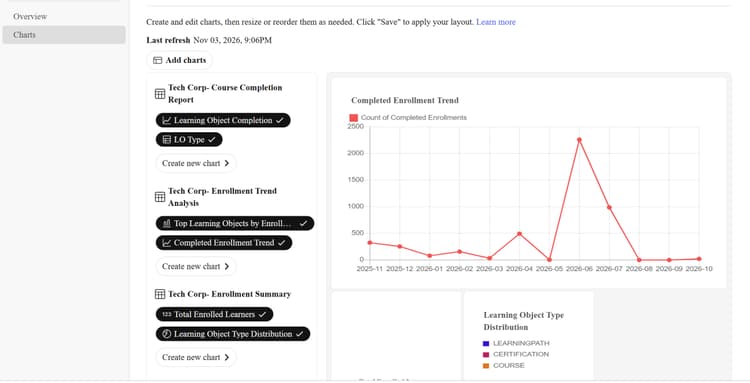
Select Charts in the left navigation pane of the dashboard.

All charts from the available reports appear on the dashboard.

Move charts in the dashboard move-charts
-
Select Edit in the upper-right corner of the dashboard. You can view the columns in each report that were used to create the charts. You can also create another chart to add to the dashboard.
-
From the left panel, select the charts you want to add to the dashboard.
-
Drag each chart to the position you want, and then release it to place the chart.
-
Repeat the previous step to arrange the charts according to your reporting requirements.
-
Select Save to save all changes in the dashboard.
Share a dashboard share-dashboard
Share a Report Builder dashboard with other Administrators so they can view the same charts and data.
Charts you create from a report are saved with that report. When you share the report, other Administrators get the charts too. Share a dashboard once instead of asking each Administrator to rebuild it.
Share a dashboard with other Administrators share-with-administrators
-
Sign in to Adobe Learning Manager as an Administrator.
-
Select Reports, and then select Report Builder.
-
Select the Reports tab, and then open the report that contains the dashboard.
-
Select Actions > Share.
-
Under Share, select Edit.
-
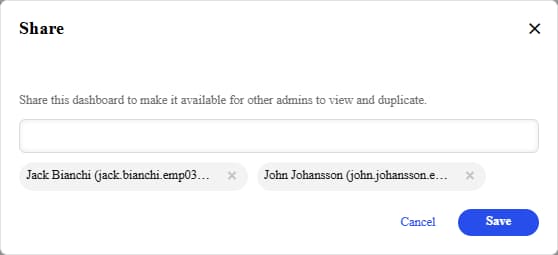
Select the Select users / usergroups field.
-
Search for and select the Administrators or user groups you want to share with.
-
Select Save.
The selected Administrators can now view the report and its charts in their Report Builder view.
Remove shared access remove-shared-access
- Open the report, and then select Actions > Share.
- Under Share, select Edit.
- Deselect the Administrator or user group.
- Select Save.
Best practices for sharing sharing-best-practices
- Share one well-configured report instead of letting each Administrator build a variation. This keeps one authoritative version of the data.
- Create the report with filters that apply to everyone you share it with, so all viewers see consistent charts.
Delete a dashboard delete-dashboard
Delete a Report Builder dashboard when you no longer need it. Deleting a dashboard permanently removes it and its associated sharing settings. You can’t undo this action.
-
Sign in to Adobe Learning Manager as an Administrator.
-
Select Reports, and then select Report Builder.
-
Select the Reports tab, and then open the dashboard you want to delete.
-
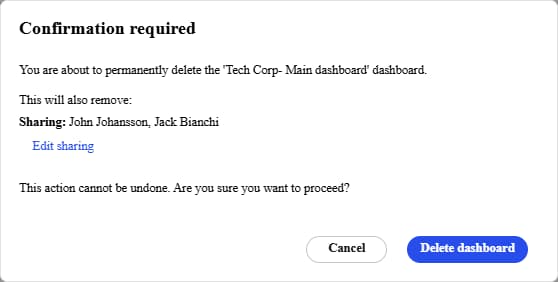
Select Actions > Delete. The Confirmation required dialog appears. It displays the dashboard name and the users with whom the dashboard is shared.
-
Select one of the following options:
- Edit sharing: Review or change the users with whom the dashboard is shared.
- Cancel: Close the dialog without deleting the dashboard.
- Delete dashboard: Permanently delete the dashboard and remove its sharing settings.