Apply group by and aggregations in Report Builder
Overview
Group by and aggregation let you produce summary reports, such as total completions per instructor, enrollment count per catalog, or compliance percentage by region.
When to use group by
Use group by when you want one row per category rather than one row per record. For example:
- One row per instructor, showing how many sessions they taught
- One row per catalog, showing total enrollments
- One row per user group, showing compliance percentage
If you want to see individual learner records or individual enrollment rows, don’t apply group by.
When you apply group by to one column, every other column in the report must have an aggregate function applied. You can’t show a raw field value alongside a grouped column- only a calculated value (count, sum, average, and so on).
For example, if you group by Instructor Name, you can’t show individual Session Name values alongside it. Instead, you’d apply Count to the Session ID field to show how many sessions each instructor taught.
Apply group by and aggregations
In this example, you’ll compare enrollment progress across learners. Use this report to understand how different managers are performing in terms of enrollment progress and completion.
Select columns
-
Launch Report Builder and select Create Report.
-
Type the name and description of the report:
- Name: Compare enrollment progress across users
- Description: This report groups learners by manager and calculates summary metrics such as total learners, average progress, and completion counts for enrollment status=COMPLETED
-
Select the following columns: :
- User - Manager Name
- User - Name
- Enrollment - Status
- Enrollment - Progress Percent
- Learning Object - Completion Count
Select Group by columns
-
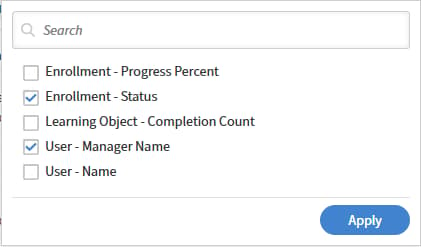
Select the following columns in the Group by section:
- Enrollment - Status
- User - Manager Name
-
Select Apply.
Select columns to aggregate
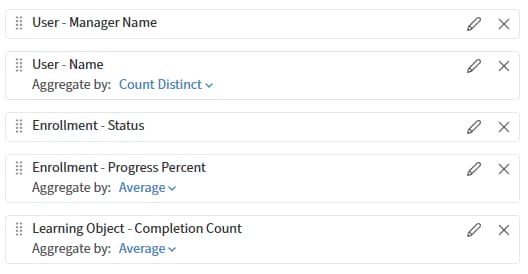
The aggregate functions summarize learner enrollment performance by manager and enrollment status, showing distinct learner counts, average training progress percentages, and average learning object completion counts across grouped training records.
-
Select Count Distinct for User-Name.
-
Select Average for Enrollment - Progress Percent.
-
Select Average for Learning Object - Completion Count.
Apply filters
Apply filters to include only completed enrollments and exclude records with missing manager names, ensuring the report analyzes valid learner data for accurate manager-wise training progress and completion insights.
- Apply a filter where Enrollment - Status equals Completed.
- Apply a second filter where User - Manager Name is not empty.
- Combine both filters using the AND condition to include only valid completed learner records.
Save and download the report
Select Save Report and select Actions > Download to download the report. You’ll receive a notification to download the report (CSV) once it’s ready.
The CSV contains a manager-wise summary of completed learner enrollments and training progress. Each row represents a manager and includes learner counts, enrollment status, average progress percentage, and average completion counts.
Overall, the report compares training completion and learning activity across managers, highlighting differences in learner engagement and the number of completed learning objects.