Get started with global reports global-report-gs
The Global reports serve as an effective tool, offering a consolidated overall summary of traffic and engagement metrics for each channel within your Campaign instance. These reports consist of various widgets, each offering a distinct perspective on your campaign or delivery performance.
Key Performance Indicators (KPIs) refresh hourly, ensuring up-to-date insights. By default, data filters cover the past 30 days, offering a current and relevant perspective on your campaigns and deliveries performance.
The full list of reports and associated metrics for each channel is available in the following pages:
Manage your report dashboard manage-reports
To access and manage your Global reports, follow these steps:
-
Navigate to the Reports menu within the Reporting section.
-
In the left menu, select a report from the list and navigate through the tab to display data from each channel.
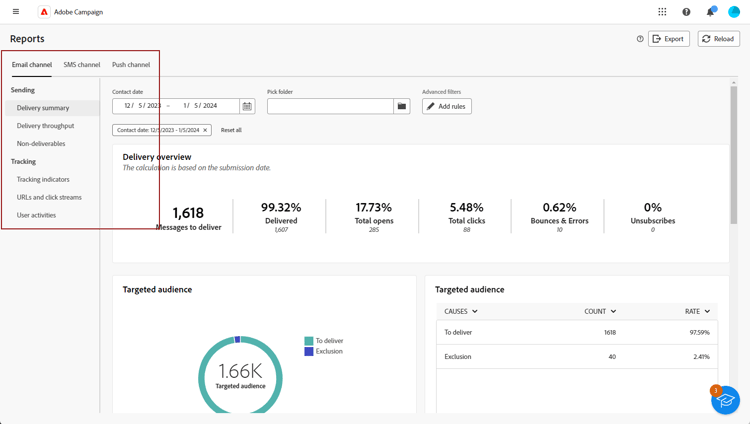
-
From your dashboard, choose a Start and End time to target specific data.
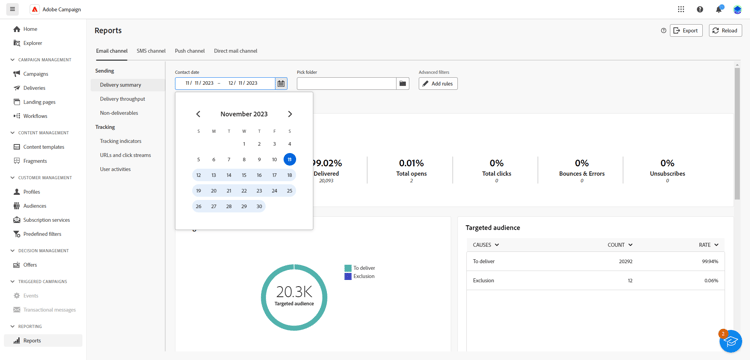
-
From the Pick folder field, select whether to target deliveries or campaigns from a specific folder.
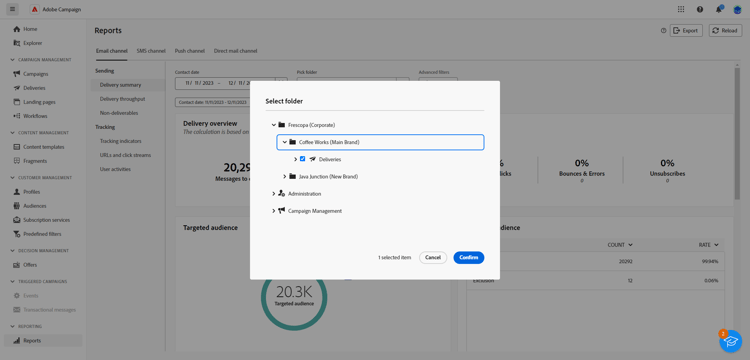
-
Click Add rules to start building queries to better filter reporting data. Learn how to use the query modeler.
-
From the URLs and click streams, choose the Top visited Links or the Time period.
The View by options allow filtering on URLs, Labels, or Categories.
Reports for the LINE channel line-reports
The reports available for the LINE channel are described below.
Delivery overview line-delivery-overview
The Delivery overview report displays the messages to deliver, delivered messages, and delivery errors for LINE.
Targeted audience line-targeted-audience
The Targeted audience graph and table display the audience targeted by the LINE delivery and the resulting delivery outcomes.
Delivery statistics line-delivery-stats
The Delivery statistics graph and table display key delivery results for LINE messages, including messages to deliver, delivered messages, and delivery errors.
Causes of exclusion line-exclusions
The Causes of exclusion graph and table display why targeted profiles were excluded from the LINE delivery, such as eligibility, validation, or configuration rules.
Delivery throughput line-delivery-throughput
The Delivery throughput report displays the sending rate of LINE messages over time.