ESM Dashboard esm-dashboard
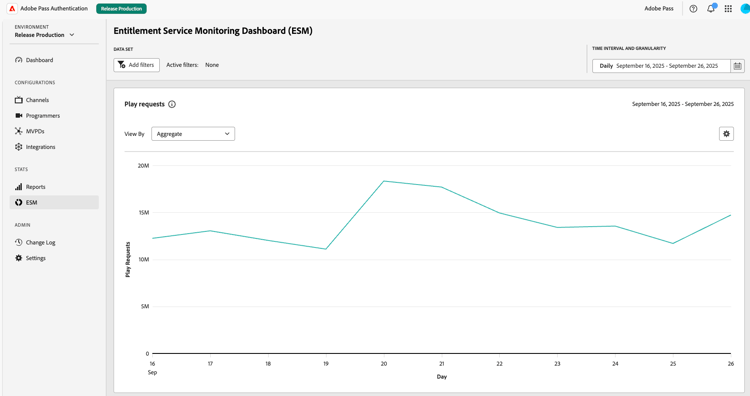
The ESM Dashboard provides a unified view of entitlement and events data to help you monitor performance, identify anomalies, and understand user access patterns across MVPD partners. This guide explains how to use the dashboard’s filters, interpret reports, and understand key metrics over configurable time intervals.
Use cases use-cases
- Visualize trends per platform or MVPD
- Compare MVPD performances
- Understand customer usage per application
More details about ESM data and events can be found at Entitlement Service Monitoring Overview.
Reports reports
The following reports are available:
Play requests play-requests
Shows the number of play requests for the selected time interval.
Graph style – line.
Authentication conversion authentication-conversion
Shows the ratio between successful authentication events and the total number of authentication attempts.
Graph style – horizontal bar
Authorization conversion authorization-conversion
Shows the ratio between successful authentication events and the total number of authentication attempts.
Graph style – horizontal bar
Authorization latency authorization-latency
Shows the average latency (in milliseconds) for MVPD responses.
Graph style – line.
MVPD Usage mvpd-usage
Shows a comparison of the number of unique users per MVPD.
Graph style – area stacked.
Successful authentications successful-authentications
Shows the total number of successful authentications for the selected time interval.
Graph style – line.
Successful authorizations successful-authorizations
Shows the total number of successful authorizations (MVPD’s ‘Permit’ responses) for the selected time interval.
Graph style – line.
Actions actions
View by view-by
For each graph, there is a “View by” dropdown that enables you to select exactly which data to display.
- Aggregate – displays overall data
- MVPDs / Channels / Platforms – outlines the specific filters selected
Download download
You can download the raw data:
- Download chart data as CSV – downloads data for a specific chart
- Download all data as CSV – downloads all ESM data across all graphs
Filters filters
Use filters to narrow the dataset and focus the analysis. The following filters are available:
- Channel: includes all channels (brands) available
- MVPD: focus on one or more providers
- Platform: web, mobile, connected TV, or device family
To add a new filter, select “Add filters” button.
In the “Data set filters” page, you can drag and drop needed filters.
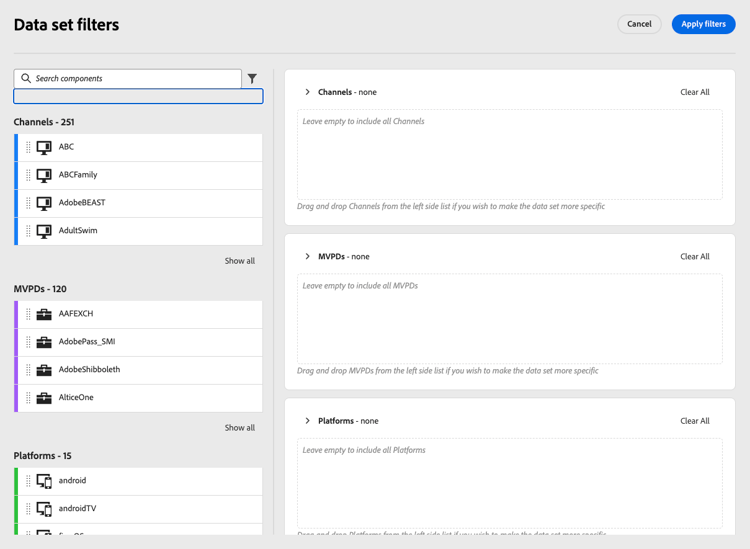
For each section you can remove filters individually or clear the whole selection.
Filter tips filter-tips
- Combine multiple filters to isolate a cohort (e.g., one MVPD on a mobile platform for a channel).
- Don’t add filters to zoom out and establish a baseline before drilling in.
Time Intervals time-intervals
Control the analysis window and granularity.
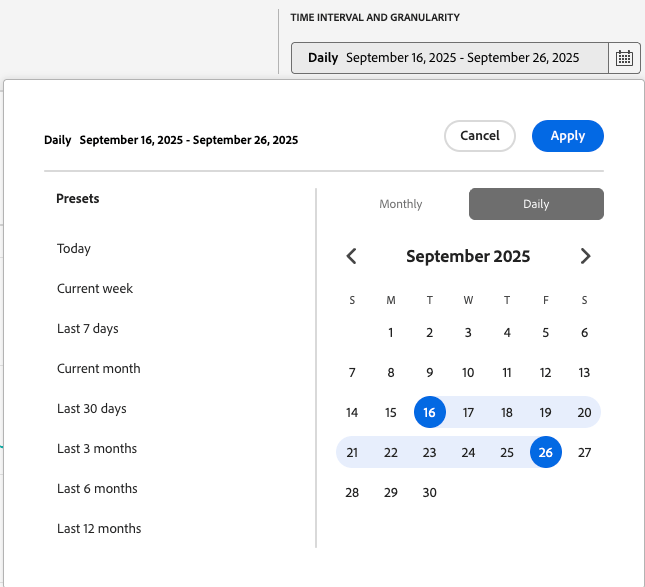
Date Range date-range
Presets: Today, Current week, Last 7 days, Current month, Last 30 days, Last 3 months, Last 6 months, Last 12 months
Custom: Select desired time interval
Granularity granularity
Daily / Monthly