Validate data with Coworker when upgrading from Adobe Analytics to Customer Journey Analytics
-
Recommended upgrade steps (Recommended for most organizations)
A set of steps that lead to an ideal Customer Journey Analytics implementation.
For detailed information, see Upgrade from Adobe Analytics to Customer Journey Analytics.
-
Customer Journey Analytics Upgrade Guide (Custom steps tailored to the specific needs of your organization)
A new upgrade guide is available that dynamically generates upgrade steps that are tailored for your organization and your unique circumstances.
To access the guide from Customer Journey Analytics, select the Workspace tab, then select Upgrade to Customer Journey Analytics in the left panel. Follow the on-screen instructions.
CX Enterprise Coworker includes a validation skill that allows you to validate data when upgrading from Adobe Analytics to Customer Journey Analytics. Data validation is completed within a single conversation.
This skill automatically compares:
-
Each dimension, metric, and trend individually across implementations.
-
All Adobe Analytics report suites against all Customer Journey Analytics data views.
After making these comparisons, the skill generates AI-driven insights and recommendations that you can implement to facilitate your upgrade to Customer Journey Analytics.
Before you begin
To validate data as part of your upgrade, you need:
-
The Adobe Analytics report suite you want to validate.
-
The Customer Journey Analytics data view that contains the same data.
You don’t need to know how your implementation is architected. The skill automatically detects whether your Customer Journey Analytics implementation uses the Analytics Source Connector or a new implementation of the Experience Platform Web SDK.
Start a validation session
-
Log in to CX Enterprise Coworker.
-
Select New Chat.
-
In the text field, prompt the agent to validate your upgrade from Adobe Analytics to Customer Journey Analytics:
Prompt
Help me validate my company’s upgrade from Adobe Analytics to Customer Journey Analytics.
Your request is routed to the data validation skill, which starts an interactive setup process.
-
The setup process includes the questions in the table below. For each question, select an answer, then select Submit.
note NOTE You can change any of these selections later in the same conversation. For example, ask the agent to change your report suite or data view, and the agent repeats only the steps needed to update that selection, without restarting the entire setup process. table 0-row-2 1-row-2 2-row-2 3-row-2 Question Additional context Select your Analytics company This is your Adobe Analytics login company. Select your report suite This is the report suite in Adobe Analytics that contains the data that you want to validate against the Customer Journey Analytics data. Select your Customer Journey Analytics data view This is the data view in Customer Journey Analytics that contains the same data as the Adobe Analytics report suite that you selected. -
Review the setup summary to confirm you’re validating the right data before you continue. The summary includes the company, report suite, and data view you selected, along with a preview of the top metrics and dimensions in each system.
-
Continue with the following section, Choose the data to validate.
Choose the data to validate
You can validate individual metrics or dimensions, or you can validate all metrics and dimensions that are included in the report suite and data view.
-
Select from the following options:
table 0-row-2 1-row-2 2-row-2 3-row-2 Validation option Description Single metric comparison Compare one metric’s trend between Adobe Analytics and Customer Journey Analytics. Use this when you want a quick check on a specific metric, such as page views or visits. Single dimension comparison Compare the breakdown of a single dimension between Adobe Analytics and Customer Journey Analytics. Use this when you suspect a mapping or classification difference for a specific dimension. Full report suite and data view audit Compare up to 40 Adobe Analytics metrics and 20 dimensions with their Customer Journey Analytics counterparts in a single run. Use this when you want a comprehensive view of your upgrade’s overall health. -
Continue with the following section, Review the analysis.
Review the analysis
-
Select the Overall matching rate tab to view a percentage that indicates how closely the data from the Adobe Analytics report suite matches that of the Customer Journey Analytics data view. This score always appears first, before any other results. It weighs every compared metric and dimension equally to ensure that high-volume metrics, such as page views, don’t skew the score.
Use the following scale to interpret the score:
table 0-row-3 1-row-3 2-row-3 3-row-3 4-row-3 Score Rating What it means 97%–100% 
All properties are highly aligned. No action required. 90%–96% 
Minor gaps are present. Monitor trends and investigate if they decline. 75%–89% 
Meaningful gaps exist. Investigate root causes before relying on Customer Journey Analytics data. Less than 75% 
Significant misalignment. Take immediate action before using Customer Journey Analytics data. -
Select the Key insights tab to view two to four short callout boxes, each summarizing one finding from the analysis in a single sentence. Callouts are color-coded by severity so you can spot the most important findings first.
-
Select the Summary tab to view Adobe Analytics totals, Customer Journey Analytics totals, total variance, days passing, and days critical, where days passing and days critical reflect how many days in the date range fall into the Pass and Critical variance statuses described below.
-
(Conditional) When doing a single-dimension comparison or a single-metric comparison, you can view a side-by-side comparison of the Adobe Analytics data and the Customer Journey Analytics data in the Daily trend tab.
For metrics, this is a line chart that compares the daily trend.
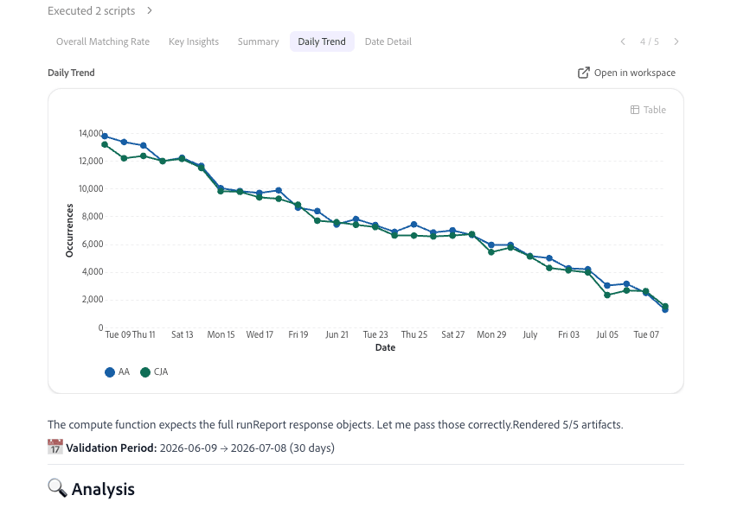
For dimensions, this is a bar chart that compares the top values.
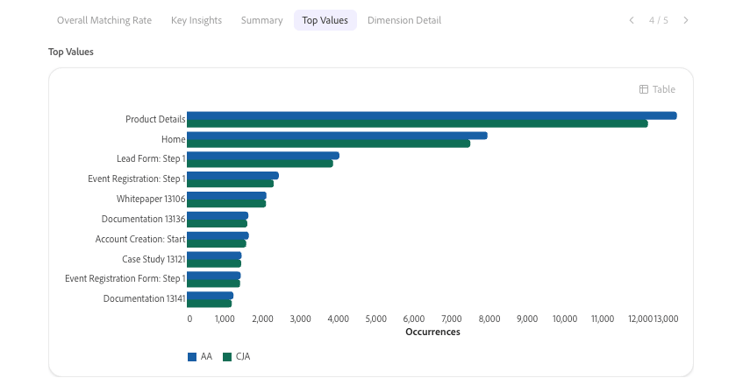
-
(Conditional) When doing a single-dimension comparison or a single-metric comparison, you can view row-level detail in the Date detail tab. This table lists the date, the Adobe Analytics value, the Customer Journey Analytics value, the variance percentage, and a status badge for each compared metric or dimension value.
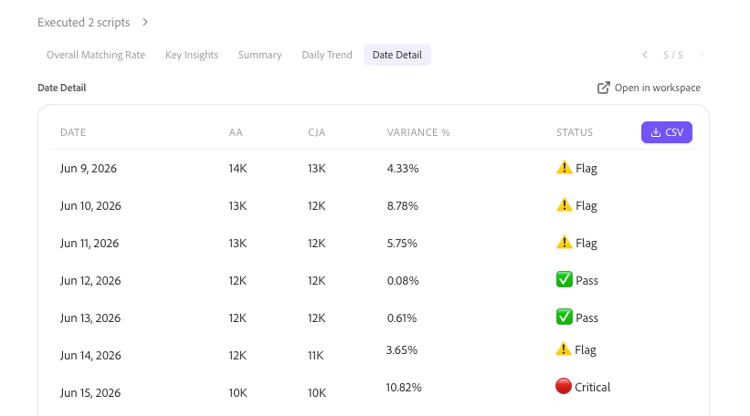
The variance and status columns use the following scale:
table 0-row-3 1-row-3 2-row-3 3-row-3 Variance Status What it means Less than 3% 
Data is well aligned. No action required. 3%–10% 
Monitor the difference and investigate if it continues or worsens. Greater than 10% Investigate immediately. This usually points to a schema, ingestion, or mapping issue. -
(Conditional) When running a full report suite and data view audit, the Daily trend and Daily detail tabs are replaced by a scorecard showing pass, flagged, and critical counts, along with separate tables listing the top five best-matching and top five lowest-matching metrics and dimensions.
-
Scroll down in the analysis to view additional patterns and issues that were discovered during the analysis, likely causes for those patterns, and suggested actions that you can take to resolve any data discrepancies.
note NOTE Some variance is expected and doesn’t indicate a problem with your upgrade to Customer Journey Analytics. Common issues include:
- Adobe Analytics counts device-based visitors, while Customer Journey Analytics counts people, using cross-device identity stitching.
- Adobe Analytics processes data at collection time, while Customer Journey Analytics processes data at report time.
- Session definitions differ: Adobe Analytics visits use a fixed timeout, while Customer Journey Analytics sessions are configurable.
- Adobe Analytics filters bots by default, while Customer Journey Analytics bot filtering is opt-in.
- Adobe Analytics reports missing values as “Unspecified” or “None,” while Customer Journey Analytics reports them as “No value.”
- Marketing channel differences can result from Adobe Analytics processing rules compared to Customer Journey Analytics derived fields applied retroactively.
- If Customer Journey Analytics values are consistently about twice the Adobe Analytics values across all metrics, this usually indicates duplicate data in the data view rather than an identity stitching effect.
-
Verify that the suggested actions are valid, then resolve them in Adobe Experience Platform or Adobe Analytics.
-
(Optional) Continue your analysis by analyzing another metric, analyzing another dimension, or by running another report of up to 40 metrics and 20 dimensions, as described in Choose the data to validate. You don’t need to repeat the setup process to do this; your company, report suite, and data view selections carry forward throughout the conversation.
-
Continue following the recommended upgrade steps or the dynamically generated upgrade steps in the Customer Journey Analytics Upgrade Guide. To access the guide from Customer Journey Analytics, select the Workspace tab, then select Upgrade to Customer Journey Analytics in the left panel. Follow the on-screen instructions.