Fixing errors
Fix birth day and month
-
Click on the arrow icon next to the calculated field populating the person.birthDayAndMonth XDM field

-
Update the expression using the below calculated field code and click Preview
code language-none concat(date_part("mm", date(birth_Date, "M/d/yyyy")).toString(),"-", date_part("dd", date(birth_Date, "M/d/yyyy")).toString())note NOTE Data should appear as 2 digit month and 2 digit day (i.e. April 27 shown as 04-27). The mmand theddparameters add 0 padding. -
If everything looks good Save the calculated field
-
Then click Finish to execute the dataflow ingestion.
Validate ingestion
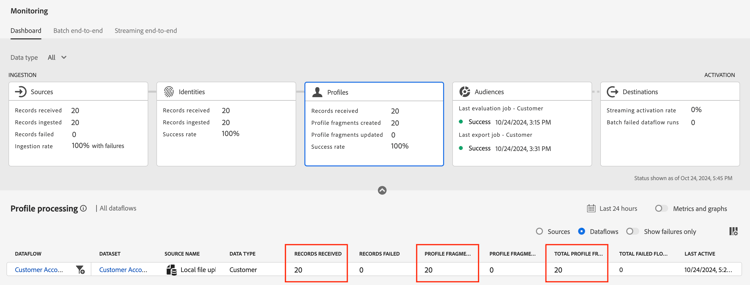
After a few minutes the dataflow run should run and you should see success!
Monitoring screen
-
Navigate to the monitoring screen by clicking the left rail on the Monitoring icon under the Data Management section.
-
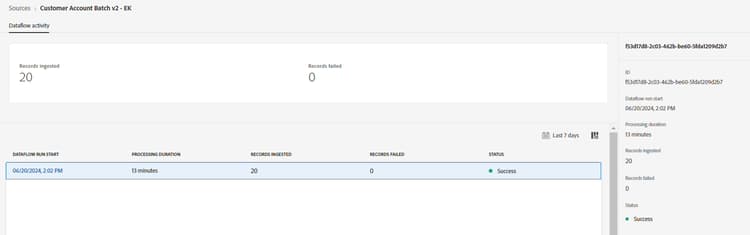
Click on the Sources card and then scroll on the bottom bar to see the details for your dataflow run. Note the following:
- Records received: 20 records were received from the source for processing
- Records ingested: 20 records were ingested into the Data Lake after the mapping and the data processing.
- Records failed: You should see a 0 here. This represents the total number of INGEST and DCVS errors. It excludes the MAPPER warnings.
- Ingestion rate: This is the ratio of records ingested to the records received. 100% of the records received were successfully processed
Identities
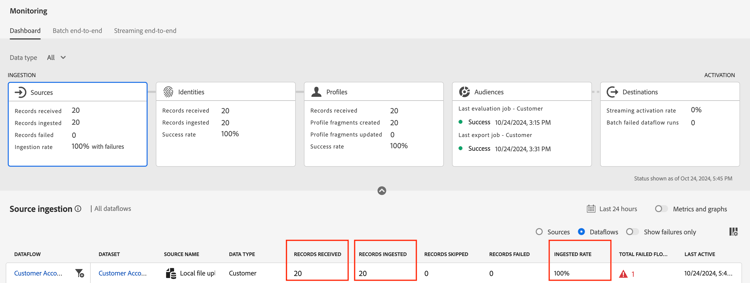
Click on the Identities card and then scroll on the bottom bar to see the granular details for your dataflow run. Note the following on the Identity Service
- Records received: 20 records were received by the Identity Store as it was monitoring for new batches i.e. dataset was marked for Profile.
- Records ingested: 20 records were ingested (i.e. processed for identity information)
- Records skipped: None as we did not have single identity records or records with now new identity relationships.
- Success rate (only available in the card): This is the ratio of the records received to records ingested.
- Identities Added: 40 identities (20 each for CustomerID and 20 for email address) were added to the overall identity graph for the Real-Time Customer Profile
- Graphs Created: 20 unique graphs were created based on the records it processed (i.e. relationships found in each row of data)
- Graphs Updated: This would tell you if identities got added to a graph.
Profiles
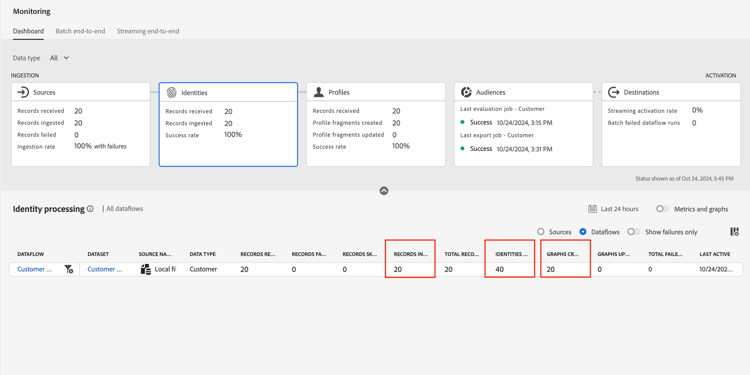
Click on the Profiles card and then scroll on the bottom bar to see the details for your dataflow run. Note the following on the Profile Service:
- Records received: 20 records were received by the Profile store for processing
- Records failed: None of the records failed. But if they had failed, then you know that it was an ingestion into Profile issue.
- Profile fragments created: 20 profile fragments were created
- Profile fragments updated: 20 overall profile fragments were touched
- Success rate: This is 100%. This is the ratio of records failed to records received.